The Jurik PCCI Bands Indicator for MT4 is a powerful and reliable trend analysis tool designed to identify potential reversal zones and short-term trading opportunities in the forex market. Ideal for scalpers and intraday traders, this indicator uses a combination of volatility channels, dynamic moving averages, and non-repainting buy/sell arrows to deliver precise entry and exit points.
This tool stands out for its accuracy and clarity, providing traders with visual confirmations of trend direction and potential turning points. The Jurik PCCI Bands Indicator is particularly useful for traders who want to trade with confidence, as it helps filter out market noise and false signals commonly found in fast-moving markets.
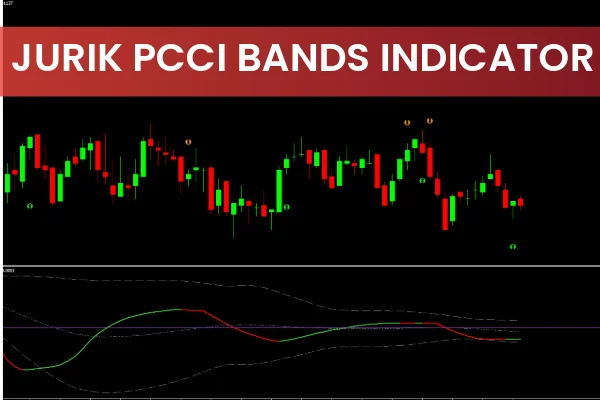
How the Jurik PCCI Bands Indicator Works
At its core, the Jurik PCCI Bands Indicator MT4 operates on two primary components:
Volatility Bands: These dynamic zones represent overbought and oversold areas of price movement.
Dynamic Moving Average (DMA): A specialized line that oscillates within the volatility channel, changing color based on market bias.
When the DMA line turns green and touches the lower band, it signals that the market might be oversold and ready for a bullish reversal.
When the DMA line turns red and reaches the upper band, it indicates a potential bearish reversal from an overbought zone.
Additionally, arrow signals are plotted on the chart to confirm trade entries:
Green arrow: A buy signal suggesting upward momentum.
Red arrow: A sell signal indicating downward pressure.
One of the key benefits of this indicator is that its arrows do not repaint, ensuring that signals remain consistent after they appear — an essential feature for serious traders who rely on data integrity.
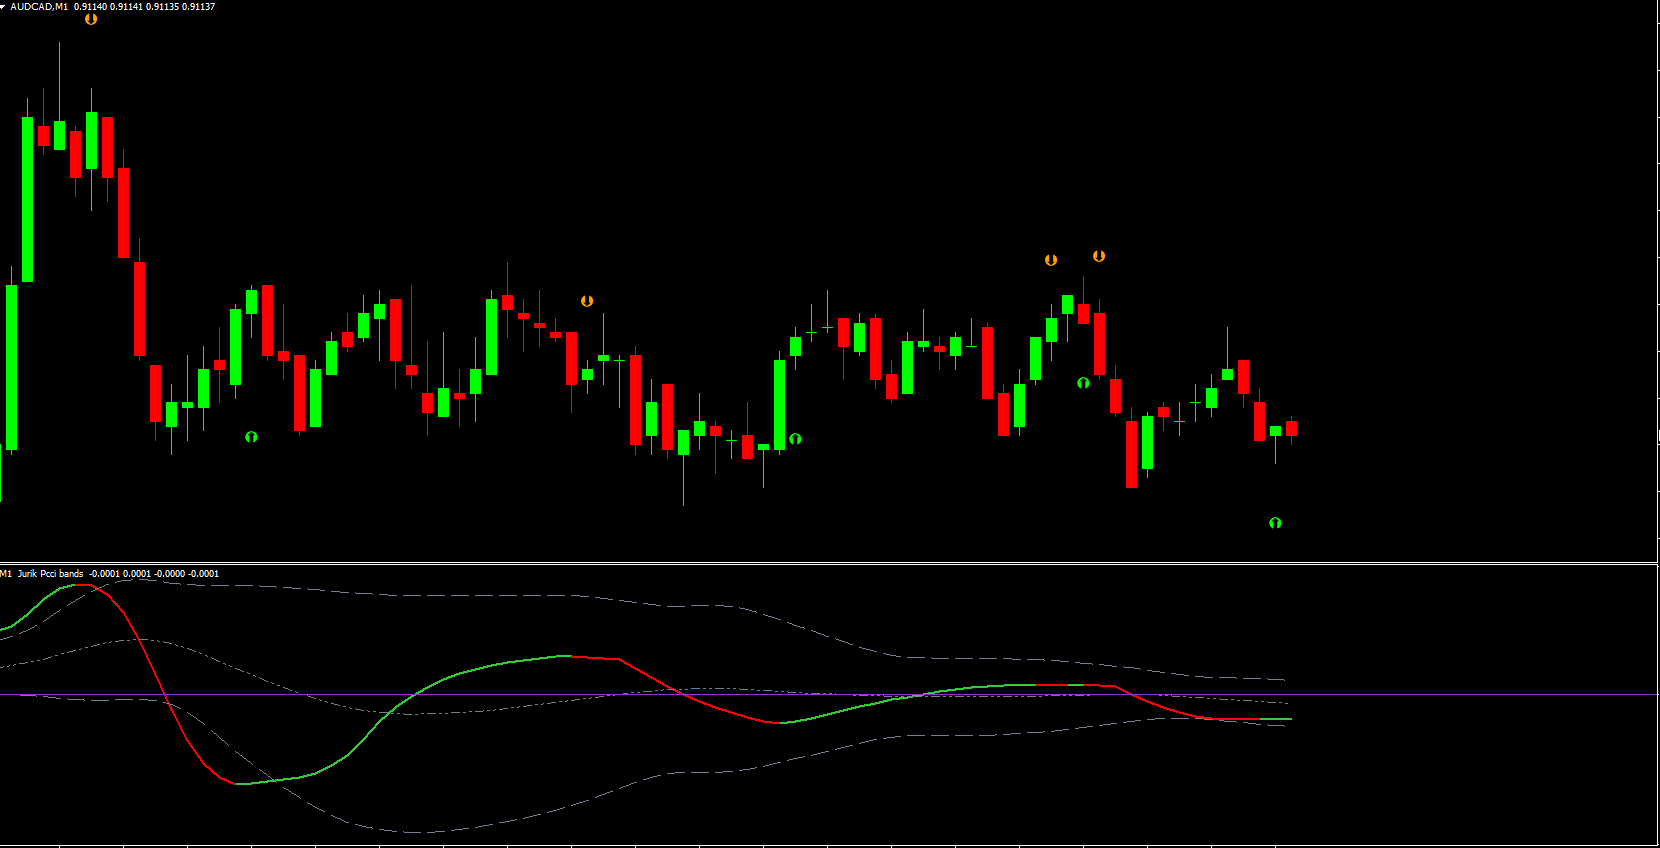
How to Trade with the Jurik PCCI Bands Indicator MT4
The attached EUR/USD chart example illustrates how traders can interpret the indicator’s signals:
When a bearish engulfing candlestick pattern forms alongside a red DMA and a downward arrow, it confirms a strong sell setup.
Conversely, if the DMA turns green near the lower band and a green upward arrow appears, it indicates a buy opportunity.
However, traders should keep in mind that no technical tool guarantees 100% accuracy. Therefore, it’s recommended to combine the Jurik PCCI Bands with Price Action confirmations (like pin bars, engulfing patterns) or other indicators (like RSI or MACD) for improved reliability.
Pro Tips for Trading with Jurik PCCI Bands
Trade in the direction of the major trend: Look for buy signals in an uptrend and sell signals in a downtrend.
Use higher timeframes (H1 or H4) for trend confirmation while trading lower timeframes for precise entries.
Avoid low-volatility market conditions, as signals may be weaker.
Combine with support/resistance levels to enhance trade accuracy.
Advantages of the Jurik PCCI Bands Indicator MT4
Non-Repainting Signals: Provides trustworthy entries that stay valid.
Dynamic Analysis: Adapts automatically to changing volatility.
Beginner-Friendly: Easy to read with clear color-coded visuals.
Ideal for Scalping: Generates high-probability short-term trades.
Free to Download: Available now on IndicatorForest.com.
Conclusion
The Jurik PCCI Bands Indicator for MT4 is a sophisticated yet user-friendly forex tool designed to detect trend reversals and volatility-based trading opportunities. Its non-repainting buy/sell arrows and dynamic color-coded moving averages make it one of the most reliable indicators for scalpers and short-term traders.
By combining this indicator with price action and trend confirmation tools, traders can enhance their accuracy and consistency in volatile markets.
Download the Jurik PCCI Bands Indicator MT4 today from IndicatorForest.com and elevate your technical analysis with this advanced volatility-based trading tool.
FAQ
6 Downloads
Published:
Nov 09, 2025 13:18 PM
Category: