The HMA Mega Indicator for MetaTrader is a refined Hull Moving Average (HMA) tool designed to identify market trends with high accuracy. Unlike traditional moving averages, the HMA incorporates advanced smoothing algorithms that filter out price noise, enabling traders to detect the true trend direction with precision. The HMA Mega Trend Indicator not only defines bullish and bearish movements but also paints buy and sell signal arrows on the chart for timely trade entries.
How the HMA Mega Indicator Works
The HMA Mega Trend Indicator operates similarly to a traditional moving average but with enhanced smoothing and speed. Its algorithm calculates a weighted average that reacts faster to market changes while minimizing lag. This means traders can rely on it to capture trend reversals earlier without being misled by random price fluctuations.
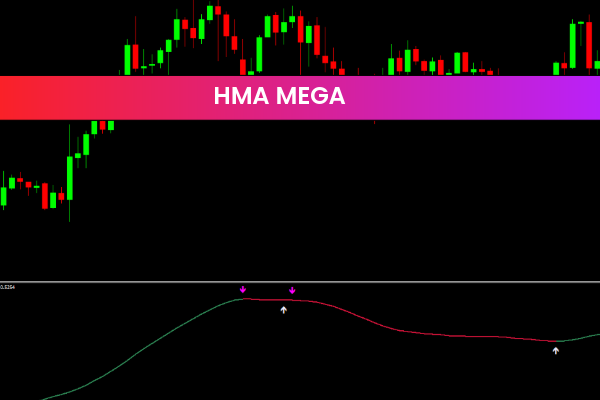
Green Line – Indicates a bullish trend direction.
Red Line – Indicates a bearish trend direction.
White Arrow – Signals a potential buy entry.
Magenta Arrow – Signals a potential sell entry.
This color-coded system helps traders make decisions visually, simplifying technical analysis for both beginners and experienced traders.
How to Trade with the HMA Mega Indicator
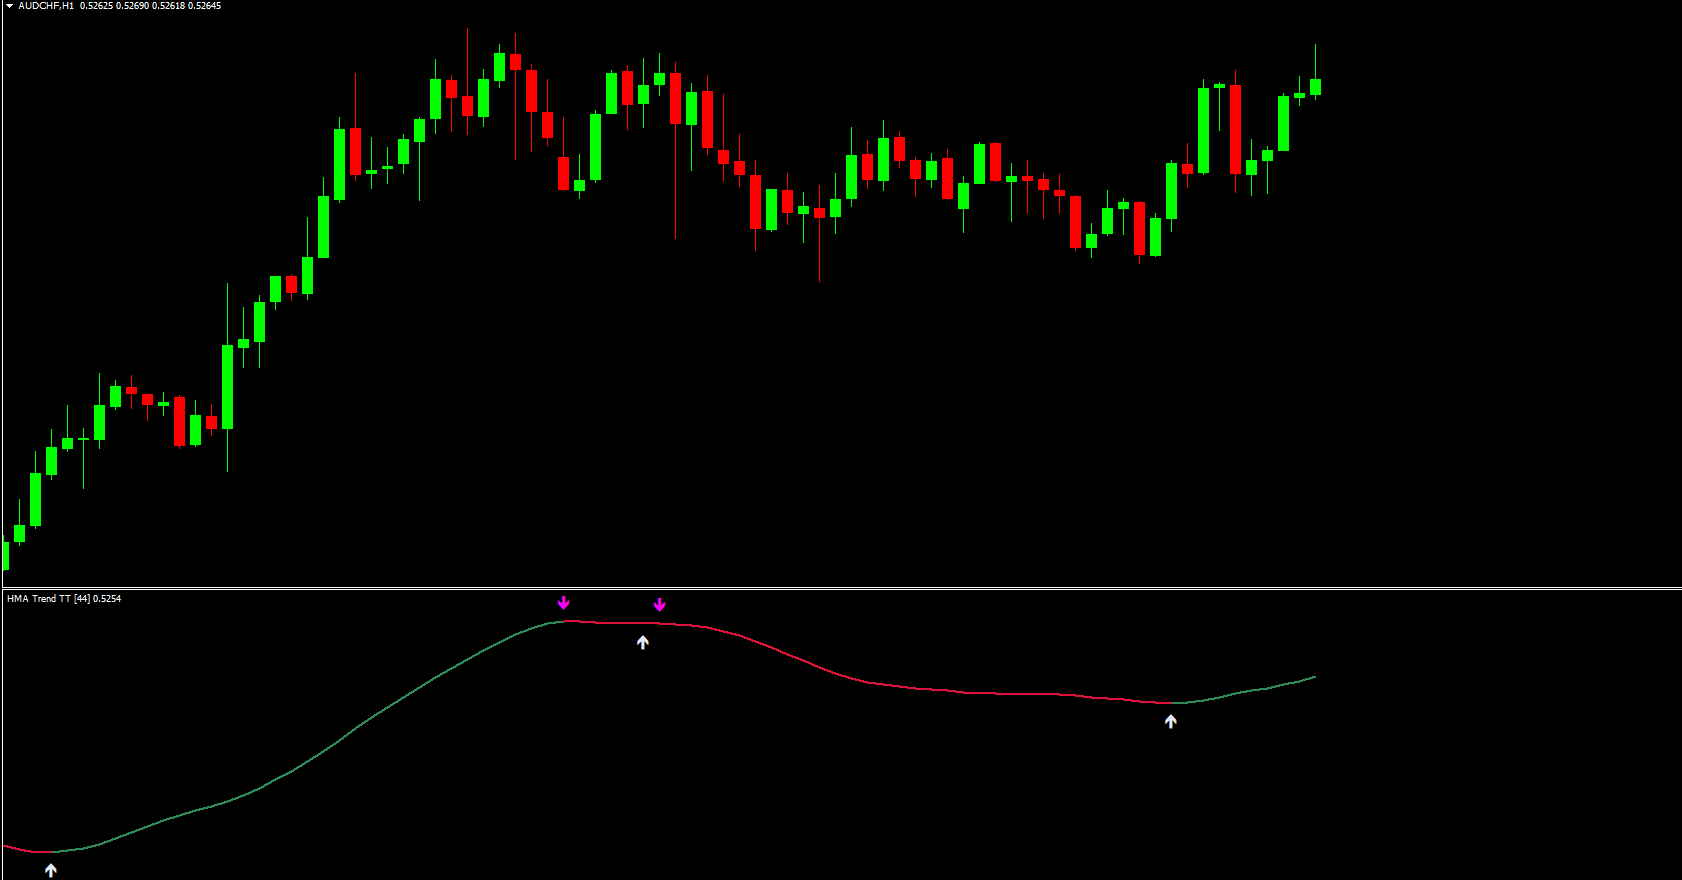
The image below illustrates how the HMA Mega Trend Indicator performs on the EURUSD H4 timeframe. The indicator clearly identifies the ongoing uptrend. In this scenario, traders should focus on buy signals (white arrows) that align with the bullish trend, while ignoring sell signals (magenta arrows) that move against it.
Step-by-Step Trading Strategy
Identify the trend direction:
Look at the color of the HMA line. A green line means the market is in an uptrend; a red line signals a downtrend.
Wait for signal confirmation:
The white arrow suggests a buy opportunity, while the magenta arrow suggests a sell setup.
Validate with Price Action:
Combine the signal with candlestick patterns (e.g., bullish engulfing) or support/resistance zones for added confirmation.
Manage your trades:
Place stop-loss orders below the recent swing low (for buys) or above the swing high (for sells). Set profit targets using recent highs/lows or trailing stops.
Trading Example
For instance, in an uptrend on EURUSD, the indicator printed a buy signal (white arrow) that coincided with a bullish engulfing candle. This combination confirmed a high-probability trade setup. The same logic applies to sell setups in a downtrend.
Who Should Use the HMA Mega Indicator
The HMA Mega Trend Indicator for MT4 is suitable for:
Swing Traders who prefer following longer-term market trends.
Intraday Traders looking for clear entries aligned with the dominant trend.
Scalpers who want fast, low-lag signals in smaller timeframes.
Scalpers, however, may choose to take both buy and sell signals, provided they align with support/resistance zones or other technical confirmations.
Advantages of Using the HMA Mega Indicator
Minimal Lag: The HMA algorithm reduces delay compared to traditional MAs.
Clear Visual Cues: Color-coded lines and arrows make interpretation effortless.
Flexible Application: Works on any currency pair, stock, or crypto chart.
Free Download: Available for free at IndicatorForest.com.
Conclusion
The HMA Mega Indicator for MetaTrader is a powerful tool that simplifies trend detection and trade timing. With its buy/sell arrows and dynamic color changes, traders can quickly recognize profitable opportunities. It performs with remarkable accuracy, ensuring minimal lag behind price movements.
Enhance your trading strategy today—download the HMA Mega Trend Indicator free at IndicatorForest.com and start trading with confidence.
4 Downloads
Published:
Jan 04, 2026 07:05 AM
Category: