Riding the Volatility: Mastering the Markets with Keltner ATR Bands
In the fast-paced world of foreign exchange trading, understanding the balance between market trend and market volatility is essential. While standard moving averages provide a glimpse into direction, they fail to account for the sudden expansions and contractions in price velocity. The Keltner ATR Bands indicator solves this dilemma, offering a dynamic volatility envelope that adapts seamlessly to shifting market conditions.
By combining a central trend measure with the Average True Range (ATR), this technical tool provides scalpers and day traders with an objective map of overbought and oversold boundaries.
The Anatomy of Keltner ATR Bands
The Keltner ATR Bands indicator consists of a smooth channel that wraps around the Price Action. Unlike fixed-width bands, this system expands during high-volatility events—such as economic news releases—and contracts during low-volatility consolidation phases. The structure is built upon three distinct lines:
- The Center Line: Typically an Exponential Moving Average (EMA), which serves as the foundational baseline for the current market trend.
- The Upper Volatility Band: Calculated by adding a multiple of the ATR to the center line. It defines the upper threshold of normal market expansion.
- The Lower Volatility Band: Calculated by subtracting a multiple of the ATR from the center line. It defines the lower threshold of normal market expansion.
Because the bands use the ATR—a dedicated metric for price volatility—they offer a much smoother, less reactive envelope than standard standard-deviation-based bands, drastically reducing false breakout signals.
Reading Volatility Extremes and Reversals
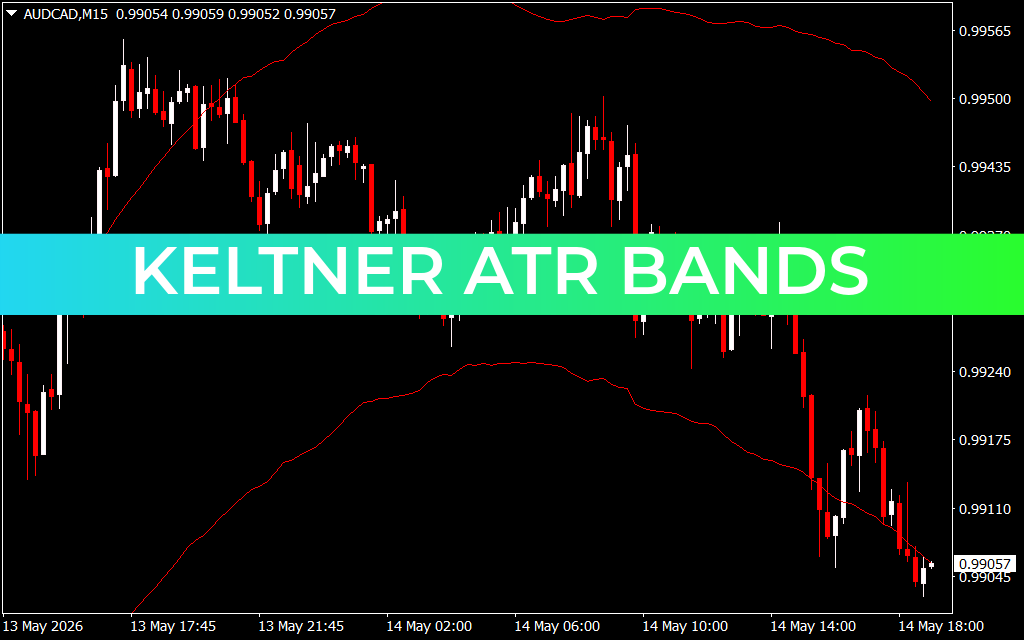
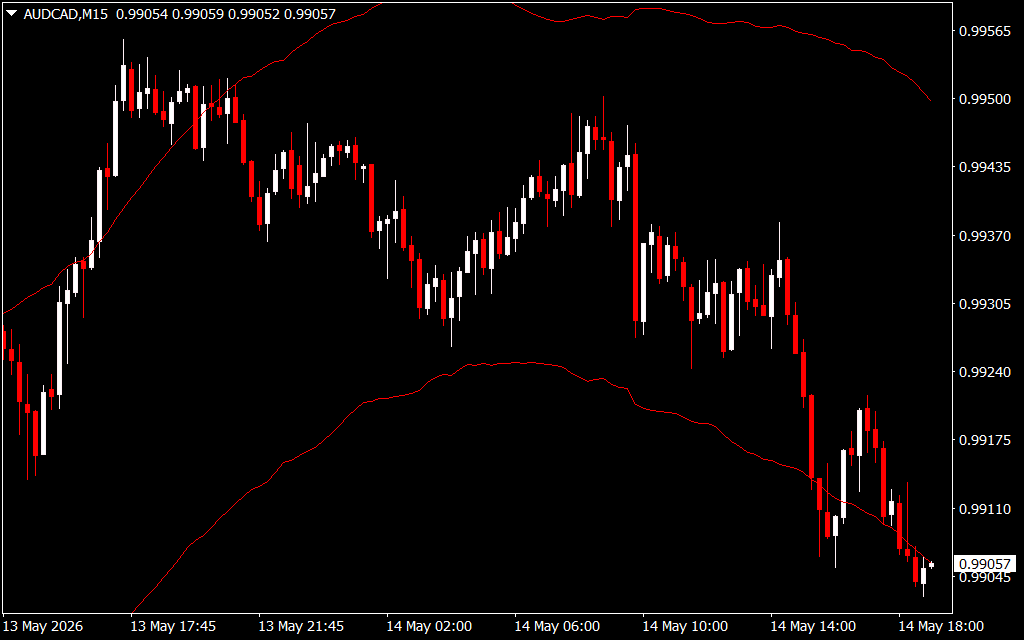
When applied to a chart, such as the AUD/CAD M15 timeframe, the Keltner ATR Bands clearly illustrate structural market limits. Under normal conditions, price action oscillates inside the red upper and lower boundaries.
When the price aggressively punctures or rides the outer bands, it signals an extreme market condition:
- Overextended Reversals: If price spikes through the lower ATR band (as seen in aggressive downward trends near structural lows like 0.99045) and begins to stall, it indicates a highly overextended market. Sellers are exhausted, creating prime conditions for a mean-reversion counter-trade back toward the center line.
- Trend Continuations: Conversely, candle closes entirely outside the bands during strong volume surges can signal a powerful institutional breakout, prompting momentum traders to ride the expanding trend.
Strategic Deployment and Risk Management
To maximize the efficacy of Keltner ATR Bands, traders often use them as a filter for entries. For mean-reversion setups, buying near the lower band or selling near the upper band gives you a logical location for stop-loss placement—just beyond the recent swing high or low outside the channel. This structural protection ensures a mathematically sound risk-to-reward ratio on every position.
2 Downloads
Last Update:
May 14, 2026 22:18 PM
Published:
Jan 22, 2026 00:35 AM
Category: