Master Price Structure with Fractals Adjustable Period Trend Lines V1
In the fast-paced world of technical analysis, identifying the true skeleton of market movement is the key to consistent profitability. While many traders struggle with subjective trend line placement, professional-grade tools like Fractals Adjustable Period Trend Lines V1 bring mathematical objectivity to your charts. This advanced indicator for MetaTrader 5 (MT5) automates the process of identifying critical swing highs and lows, drawing precise trend lines that adapt to your specific trading timeframe and strategy.
The Power of Fractal-Based Analysis
Fractals are one of the most reliable ways to identify turning points in Price Action. By definition, a fractal is a geometric pattern that repeats at every scale; in trading, it represents a high or low point where price has reversed direction. The Fractals Adjustable Period Trend Lines V1 indicator takes this concept a step further by allowing you to customize the "period" or the number of candles required to confirm a fractal.
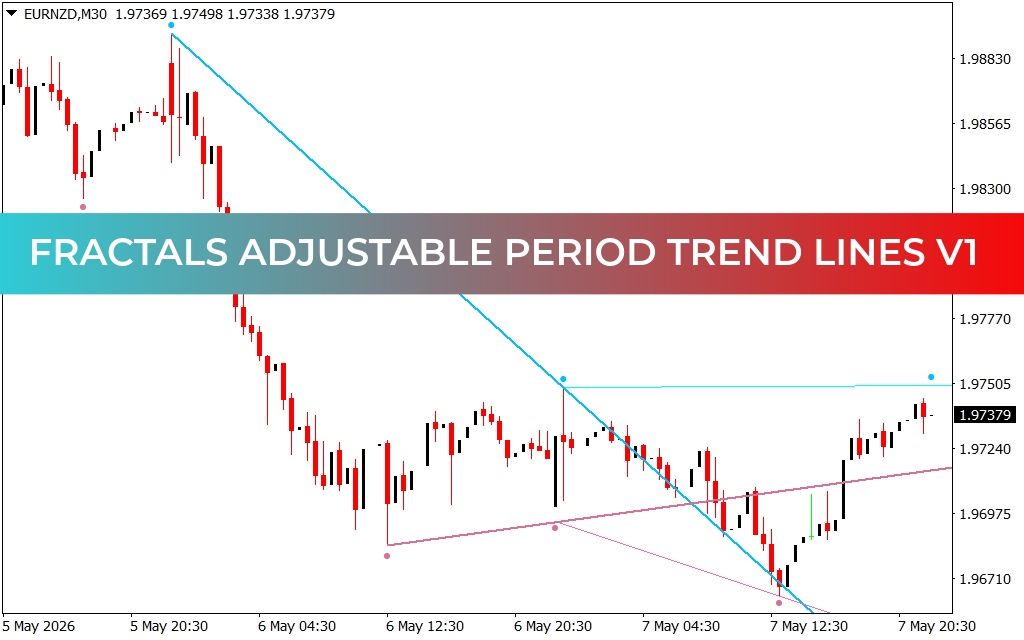
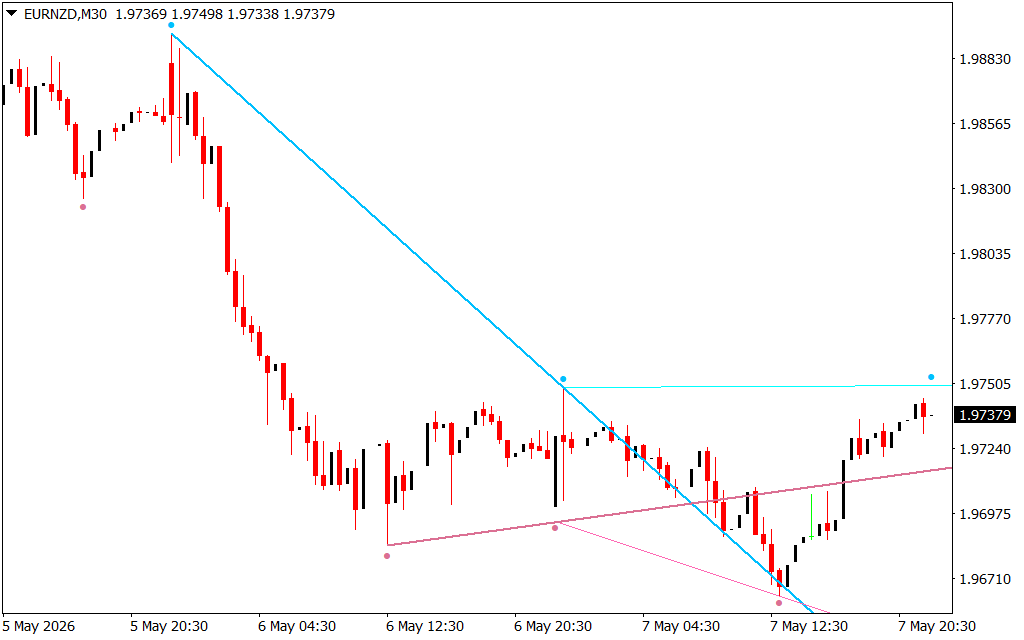
As demonstrated in the EURNZD M30 chart, the indicator identifies significant structural pivots—marked by small dots—and automatically connects them with trend lines. Unlike static lines, these Fractals Trend Lines evolve as new market data arrives, ensuring your Support And Resistance levels are always current.
Key Features of V1
- Adjustable Fractal Periods: Most standard indicators use a fixed 2-candle confirmation. This tool allows you to increase the period to find major institutional trend lines or decrease it for fast-paced Scalping.
- Automated Trend Line Construction: It removes the human error associated with manual drawing. The indicator connects the most mathematically significant points, providing a clear visual of breakouts and trend shifts.
- Multi-Directional Support: It simultaneously tracks bullish (support) and bearish (resistance) slopes, creating a clear "channel" of operation for the currency pair.
- Dynamic Breakout Identification: When price closes beyond one of these fractal-based lines, it serves as a high-probability signal that the current Market Structure is shifting.
Strategic Implementation: Trading the Breakout
The most effective way to utilize the Fractals Adjustable Period Trend Lines V1 is as a structural "road map." In the provided chart example, notice how the steep bearish trend line (blue) was breached by price action. This breakout, confirmed by the fractal pivot at the bottom, signaled a transition from a downtrend into a potential consolidation or reversal phase.
Traders often combine this tool with momentum oscillators. For instance, if price breaks above a fractal resistance line while an oscillator shows bullish divergence, the probability of a successful long trade increases significantly. By using the adjustable period, you can tune the indicator to ignore minor price "noise" and focus only on the trend lines that truly matter.
Conclusion
The Fractals Adjustable Period Trend Lines V1 is an indispensable utility for traders who prioritize structural clarity. By automating the identification of pivots and trend lines, it allows you to spend less time drawing and more time executing high-quality setups. Download this professional indicator today to bring mathematical precision to your MT5 charts.
12 Downloads
Last Update:
May 08, 2026 01:49 AM
Published:
Jan 25, 2026 23:00 PM
Category: