The Kalman Filter Indicator for MT5 is a powerful adaptive trend-following tool that helps traders identify bullish and bearish market phases with remarkable stability. Unlike traditional moving averages that react sharply to price spikes, the Kalman Filter smooths out noise and generates high-quality buy/sell signals based on real trend shifts.
Designed for both Forex and stock traders, this indicator applies a fast adaptive moving average algorithm that dynamically adjusts to market volatility. Although it supports multiple timeframes (MTF), the Kalman Filter shows its best performance on the H4 and higher charts, where long-term trends can be tracked more reliably.
How the Kalman Filter Indicator Works
The Kalman Filter originates from advanced control theory, used in engineering and finance for noise reduction and predictive modeling. In trading, it processes price data to estimate the most probable trend direction by filtering out random market fluctuations.
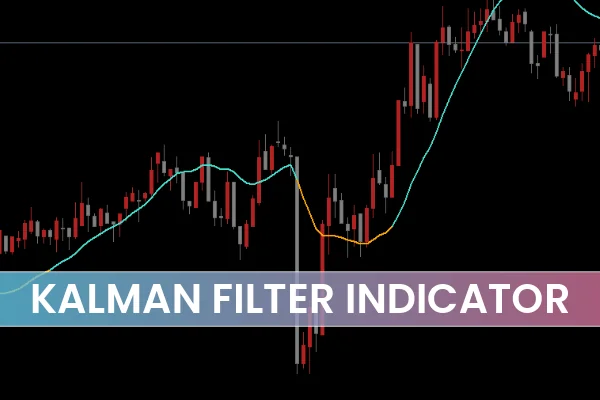
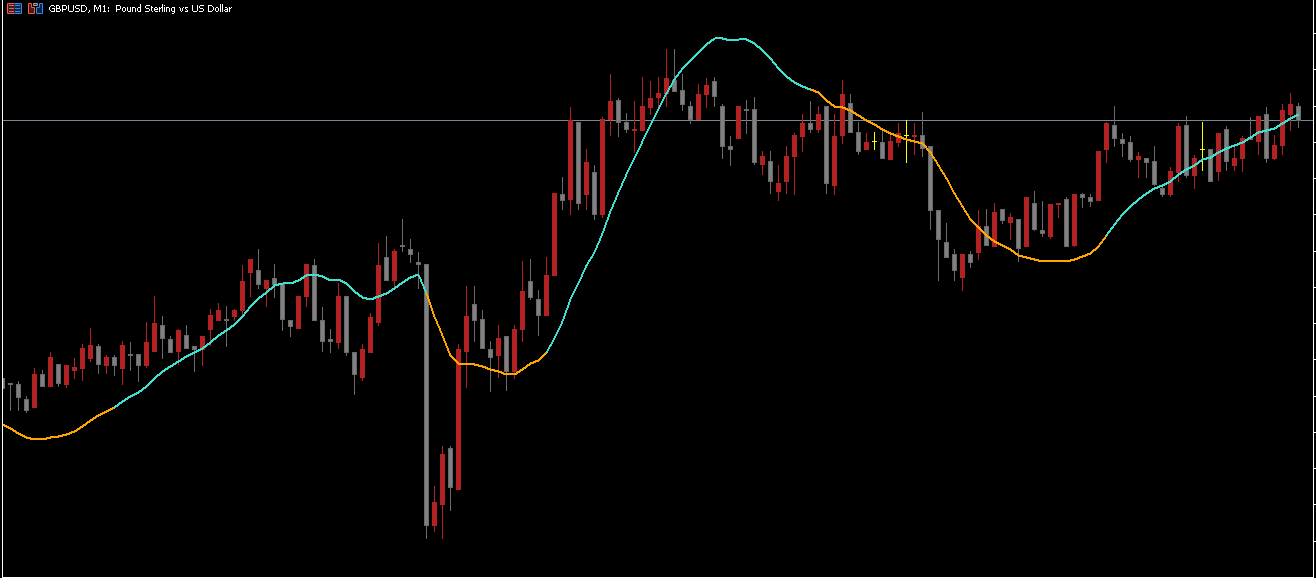
When applied to MT5, the indicator appears similar to a moving average line but offers greater predictive accuracy and less lag. It dynamically adjusts its slope and color to indicate the prevailing trend:
Turquoise Line: Indicates a bullish trend, suggesting long positions.
Orange Line: Indicates a bearish trend, suggesting short positions.
This color-coded system provides a clear visual representation of market direction, making it suitable for both beginners and advanced traders.
How to Spot Buy/Sell Signals with the Kalman Filter Indicator
Trading signals generated by the Kalman Filter Indicator are simple yet effective. Here’s how to interpret them:
Buy Signal:
When the indicator line turns Turquoise, it confirms a bullish trend.
Traders can enter a buy position at the start of the color change or after a confirmed higher low in Price Action.
Place your stop loss below the most recent swing low.
Sell Signal:
When the indicator line changes to Orange, it indicates a bearish trend.
This suggests a sell opportunity, particularly when confirmed by lower highs in price structure.
A stop loss can be placed above the latest swing high.
Unlike standard moving averages, the Kalman Filter does not frequently flip signals during volatile markets. It waits for statistically significant shifts in price movement, ensuring more reliable entries and fewer false reversals.
Why the Kalman Filter Indicator Stands Out
Traditional indicators like the SMA or EMA tend to lag in trending markets or produce false signals during consolidation. The Kalman Filter Indicator minimizes these issues through its adaptive smoothing process.
Here’s why traders prefer it:
Reduced Noise: Filters out unnecessary market fluctuations.
Adaptive Responsiveness: Adjusts dynamically to volatility changes.
Stable Signals: Avoids rapid reversals seen in regular MAs.
Multi-Timeframe (MTF) Support: Can analyze higher timeframes for long-term forecasts.
User-Friendly Visualization: Simple color-coded trend identification.
Best Timeframes and Settings for the Kalman Filter
While the indicator can be applied on all timeframes, it performs most consistently on H4 and D1 charts. These higher timeframes allow the adaptive filter to capture strong directional moves while ignoring short-term noise.
Recommended Timeframes: H4, D1, W1
Market Types: Forex, Indices, Stocks, and Commodities
Trading Style: Swing and position trading
For intraday traders, using the Kalman Filter on higher timeframes as a trend filter and entering trades on lower timeframes (like M15 or M30) can improve accuracy.
Trading Strategy Example with the Kalman Filter MT5 Indicator
Here’s a simple way to trade using this indicator:
Confirm the Trend: Observe the Kalman Filter color on the H4 or D1 chart.
Turquoise = Uptrend → look for buy setups.
Orange = Downtrend → look for sell setups.
Switch to a Lower Timeframe (e.g., M30): Wait for pullbacks or minor retracements.
Enter in Trend Direction: Enter trades once the pullback ends and the price resumes in the trend direction.
Exit Strategy: Close trades when the indicator color changes or at a predetermined risk-reward ratio (e.g., 1:2).
This top-down approach ensures that trades align with the broader market trend while providing precise entries.
Tips for Using the Kalman Filter Effectively
Combine it with price action confirmation such as breakouts or support/resistance levels.
Use additional filters like RSI or MACD to confirm entry strength.
Avoid trading during low-volatility sessions or when the indicator appears flat.
Test the indicator on a demo account to find the optimal settings for your trading pair.
Conclusion
The Kalman Filter Indicator for MT5 is a cutting-edge tool for traders who value stability, accuracy, and adaptability. By applying advanced mathematical filtering, it smooths price data and highlights only meaningful trend changes, minimizing false signals.
Whether you are a swing trader seeking to catch large market moves or a beginner looking for a simple yet effective trend guide, the Kalman Filter offers an excellent blend of precision and reliability.
Use it as part of your trend-following system, and watch your trading decisions become more informed and consistent.
FAQ
The Kalman Filter Indicator is a powerful adaptive trend-following tool that helps traders identify bullish and bearish market phases with remarkable stability. Unlike traditional moving averages, it smooths out noise and generates high-quality buy/sell signals based on real trend shifts using advanced mathematical filtering.
A Turquoise line indicates a bullish trend, suggesting long positions. An Orange line indicates a bearish trend, suggesting short positions. The color-coded system provides clear visual representation of market direction, making it suitable for both beginners and advanced traders.
The Kalman Filter minimizes lag and false signals seen in traditional moving averages. It waits for statistically significant shifts in price movement, ensuring more reliable entries and fewer false reversals. It dynamically adjusts to volatility changes, providing greater predictive accuracy than standard MAs.
While the indicator can be applied on all timeframes, it performs most consistently on H4 and D1 charts. These higher timeframes allow the adaptive filter to capture strong directional moves while ignoring short-term noise. For intraday traders, use it on higher timeframes as a trend filter.
Confirm the trend by observing the color on H4 or D1 chart, then switch to a lower timeframe (e.g., M30) to wait for pullbacks. Enter trades in the trend direction once pullbacks end and price resumes. Exit when the indicator color changes or at a predetermined risk-reward ratio.
1 Download
Published:
Nov 05, 2025 12:00 PM
Category: