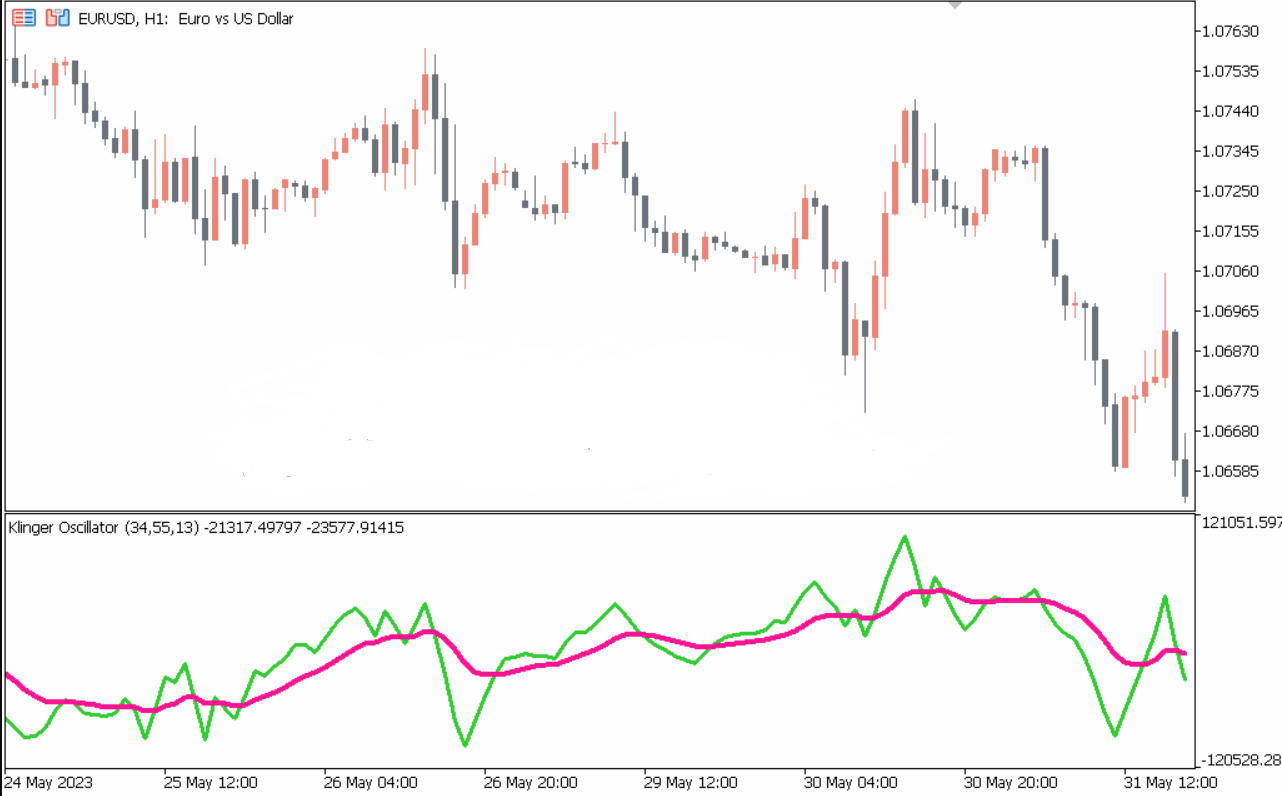
The Klinger Oscillator Indicator for MT5 is a powerful and highly accurate technical analysis tool designed for traders who want detailed insight into volume strength and trend momentum. Unlike standard volume indicators, the Klinger Volume Oscillator compares price movement with trading volume to detect market reversals before they occur. The format of this indicator resembles the well-known MACD, but its calculation method and purpose are completely unique.
The Klinger Oscillator helps traders detect market sentiment by using histogram bars and a signal line crossover system. From identifying bullish reversals to spotting bearish continuation patterns, this tool offers reliable analytical support for both manual and automated trading strategies.
Understanding How Klinger Oscillator Works
The Klinger Oscillator analyzes the relationship between volume, trend direction, and price movement. The histogram bars represent the strength of buying or selling pressure, while the signal line confirms trading sentiment.
When the histogram rises above the zero line, the indicator signals a bullish trend. Conversely, when the histogram stays below the zero level, market conditions are considered bearish. The signal line acts as a secondary confirmation, similar to oscillator-based confluence used in MACD or RSI systems.
Key Features of the Klinger Oscillator Indicator for MT5
Accurate Trend Direction
The indicator determines whether the price is trending upward or downward, making it useful for identifying long-term trend shifts.
Early Reversal Detection
The Oscillator is designed to capture volume-based momentum changes, allowing traders to detect potential reversals early—before price visibly shifts.
Histogram and Signal Line Clarity
Bullish and bearish crossovers help refine entry and exit strategies, reducing the guesswork commonly associated with traditional indicators.
Beginner-Friendly Yet Advanced
Whether you are a beginner learning Market Structure or an advanced trader analyzing market momentum, the tool adapts to multiple trading styles.
How to Trade Using the Klinger Oscillator Indicator
The most common way to trade this indicator is by watching the histogram and signal line interactions around the zero level. A buy signal is generated when:
The histogram rises above the zero line.
The signal line crosses upward.
Price structure confirms a bullish trend.
A sell signal occurs when:
Histogram falls below zero.
The signal line crosses downward.
Market structure confirms bearish sentiment.
Using the indicator alone can be effective, but pairing it with price action, Support And Resistance, or moving averages increases precision.
Best Market Conditions for Klinger Oscillator
This indicator performs exceptionally well in trending markets, especially during:
Volatility breakouts
Reversal phases
Trend continuation zones
It is recommended for Scalping, intraday trading, and swing trading across forex pairs, indices, and even commodities.
Conclusion
The Klinger Oscillator Indicator for MT5 is a versatile and reliable tool for analyzing market volume and price trends. It helps traders detect sentiment shifts, identify Trend Confirmation points, and anticipate reversal areas with strong accuracy. Whether you're a beginner or an experienced trader, this indicator is a valuable addition to your technical toolkit—and it’s completely free to download.
For more trading tools and premium forex indicators, visit IndicatorForest.com.
FAQ
1 Download
Published:
Dec 07, 2025 01:23 AM
Category: