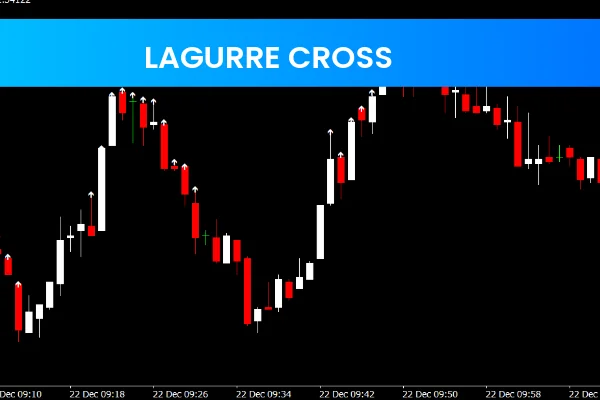
The Lagurre Cross Indicator is a popular and free Forex trading tool for the MetaTrader 4 (MT4) platform. Designed to help traders spot potential trading opportunities, this indicator uses the crossover of two moving averages to generate clear buy and sell signals.
It is versatile and can be applied to any time frame and currency pair, making it suitable for scalpers, day traders, and swing traders alike. By combining this indicator with other technical tools, traders can gain a comprehensive view of market trends and make informed trading decisions.
How the Lagurre Cross Indicator Works
The indicator consists of two lines:
Faster Moving Average (Blue Line): Reacts quickly to price changes.
Slower Moving Average (Red Line): Responds more gradually, providing trend context.
Trading signals are generated based on the crossing of these two lines:
Buy Signal: When the blue line crosses above the red line, indicating upward momentum.
Sell Signal: When the blue line crosses below the red line, indicating downward momentum.
This simple crossover system allows traders to quickly identify potential entry and exit points.
Key Features
Crossover Signals: Highlights potential buy and sell opportunities based on moving averages.
Customizable: Works on any MT4 time frame and currency pair.
Easy to Use: Clear visual representation of moving averages.
Trend Confirmation: Can be combined with other indicators like RSI, MACD, or Bollinger Bands.
Free to Download: No cost for MT4 users.
Benefits of Using the Lagurre Cross Indicator
Quickly identify trend reversals and momentum changes.
Suitable for all time frames, from 1-minute to daily charts.
Helps traders reduce emotional trading by providing clear signals.
Can be integrated into various trading strategies for better accuracy.
Free and lightweight, ensuring smooth performance on MT4.
How to Use the Lagurre Cross Indicator
Attach the indicator to your MT4 chart.
Observe the blue and red moving average lines.
Look for crossovers:
Blue line crossing above red = Buy signal
Blue line crossing below red = Sell signal
Confirm signals with other indicators or chart patterns for higher probability trades.
Adjust the moving average periods if necessary to suit your trading style.
FAQ
Published:
Dec 22, 2025 04:27 AM
Category: