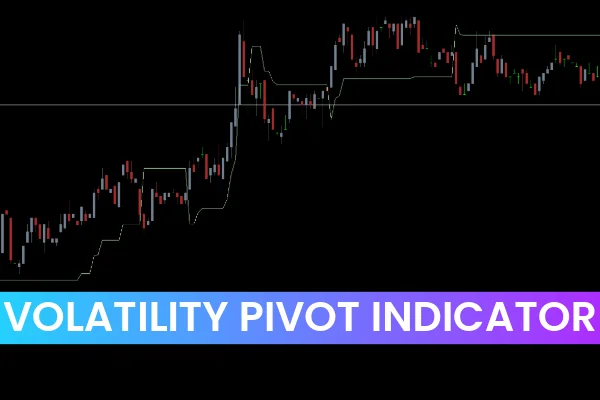
The Volatility Pivot Indicator for MT4 is an advanced trading tool designed to provide dynamic Support And Resistance levels for Forex traders. Unlike classic pivot indicators, this tool uses the Average True Range (ATR) to calculate pivot points, making them adaptive to market volatility.

Dynamic pivot lines allow traders to identify bullish and bearish market conditions more accurately. When the price is above the volatility pivot line, it signals a bullish trend, whereas prices below indicate a bearish trend.
This indicator is perfect for both new traders, who benefit from its visual trend guidance, and advanced traders, who can use the dynamic pivots to construct trendlines, channels, and other strategic setups.
You can download the Volatility Pivot Indicator for free from IndicatorForest.com and start applying it immediately on your MT4 platform.
How the Volatility Pivot Indicator Works
The indicator plots dynamic pivot lines in green, which automatically adjust according to market volatility. The ATR calculation ensures that the pivot adapts to changing Price Action, unlike static pivot levels which remain fixed.
Key insights include:
Price above pivot line: Bullish condition → consider BUY trades.
Price below pivot line: Bearish condition → consider SELL trades.
Price rejection near pivot line: Often acts as dynamic support/resistance for entries and exits.
The indicator works on intraday timeframes (M5, M15, H1) as well as long-term charts (Daily, Weekly, Monthly), providing flexibility for all trading styles.
How to Use the Volatility Pivot Indicator for MT4
Step-by-Step Trading Signals:
BUY Signal:
Price crosses above the volatility pivot line.
Open a BUY position.
Place stop loss below the previous swing low.
Exit or take profit when the price crosses downward over the pivot line.
SELL Signal:
Price crosses below the volatility pivot line.
Open a SELL position.
Place stop loss above the previous swing high.
Close the trade when the price crosses above the pivot line.
Tip: Adjust the ATR values according to the currency pair’s volatility. Pairs like GBP/JPY or EUR/USD have different volatility levels, which affects pivot calculation.
Advantages of the Volatility Pivot Indicator
Dynamic pivots adapt to market volatility for more accurate trading signals.
Clear trend direction with bullish and bearish signals.
Ideal for beginners, as it eliminates the need to manually draw support and resistance.
Works on all timeframes and all currency pairs.
Easy to download and install on MT4.
Considerations:
High volatility periods can cause wider ATR-based pivots — adjust accordingly.
Should be combined with price action or trend indicators for additional confirmation.
Best Practices for Using Volatility Pivot Indicator
Use in combination with trend filters like Moving Averages or RSI.
Monitor price reactions near the pivot line for breakout or reversal setups.
Test different ATR settings for each currency pair to match volatility.
Avoid using on extremely low-liquidity pairs where pivots may be less reliable.
Conclusion
The Volatility Pivot Indicator for MT4 is an essential tool for traders seeking dynamic support and resistance levels based on ATR. Its visual simplicity and accurate signals make it suitable for both beginners and advanced traders.
With clear bullish and bearish trend indicators, the Volatility Pivot Indicator helps you make informed BUY and SELL decisions with minimal effort.
You can download the indicator for free and start enhancing your trading strategy today at IndicatorForest.com.
For additional tools to improve pivot and trend-based trading, explore our guide on the Best Pivot Indicators for MT4.
FAQ
2 Downloads
Published:
Nov 11, 2025 22:14 PM
Category: