The Level Trading 123 Indicator for MT4 is one of the most effective tools for forex traders who rely on Fractals-based technical analysis. This indicator generates clear BULLISH and BEARISH signals while automatically plotting Support And Resistance levels derived from fractal swing points.
With these features, traders can confidently identify market reversals, trend direction, entries, and exits.
This indicator is beginner-friendly yet sophisticated enough for advanced traders who want to integrate it into multi-layered trading systems. Best of all, it works on all intraday timeframes as well as Daily, Weekly, and Monthly charts, making it suitable for both Scalping and long-term trading.
How the Level Trading 123 Indicator for MT4 Works
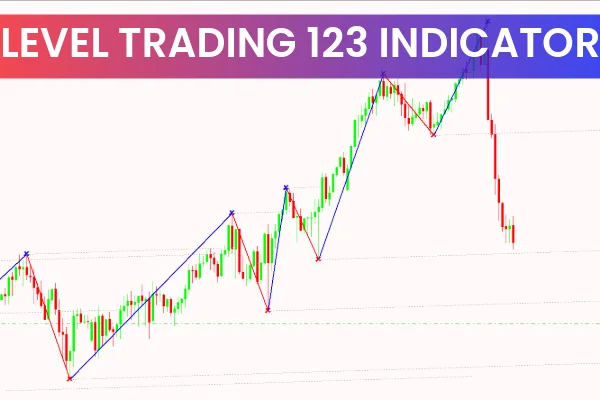
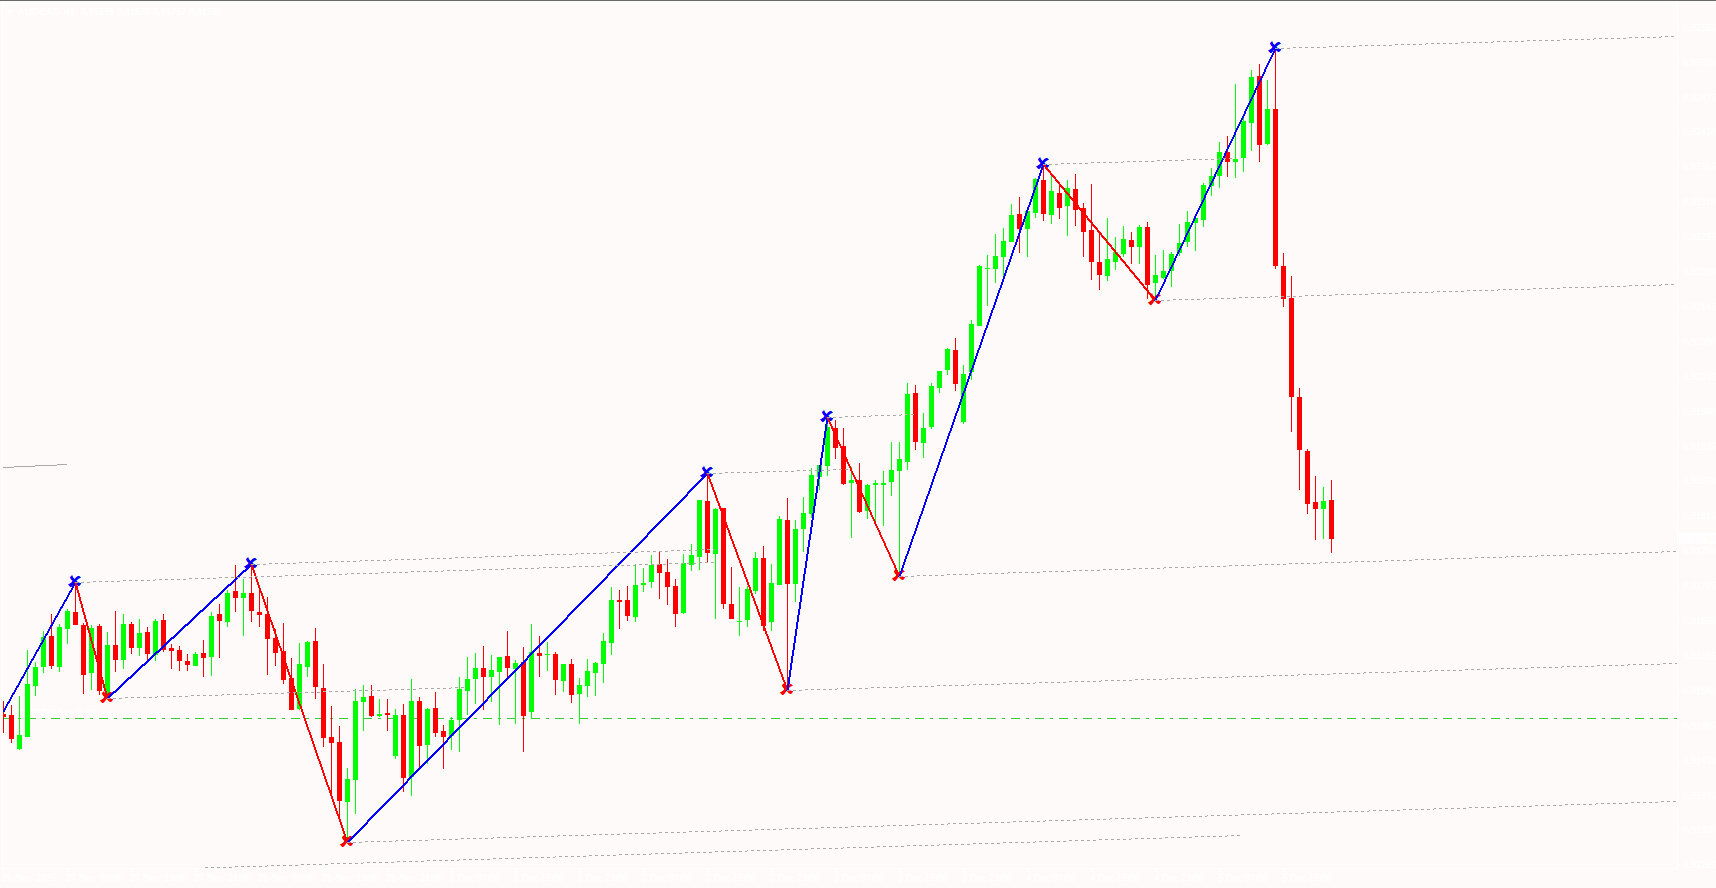
The indicator analyzes Market Structure using fractals and previous swing levels. It then displays:
BLUE lines → Uptrend
RED lines → Downtrend
DARK GREY levels → Reversal zones (support/resistance)
BLUE X → End of an uptrend
RED X → End of a downtrend

These plotted lines help traders visually interpret:
Trend direction
Reversal confirmation
Key reaction levels
Possible breakout zones
Because the reversal levels are based on fractals, price frequently reacts, respects, or reverses at these zones—making them highly reliable.
Trading Signals Generated by the Indicator
BULLISH Signal – When to Enter a BUY Trade
A BUY signal occurs when a new BLUE uptrend line is formed.
Entry:
Open a BUY position at the formation of the uptrend.
Stop Loss:
Below the previous swing low
Or below the latest reversal level
Take Profit:
Based on your preferred risk-reward ratio
Or at the next resistance/reversal region
BEARISH Signal – When to Enter a SELL Trade
A SELL signal occurs when the indicator displays a RED downtrend line.
Entry:
Open a SELL position at the beginning of the downtrend.
Stop Loss:
Above the previous swing high
Or above the nearest reversal level
Take Profit:
Based on risk-reward strategy
Or at the next support zone
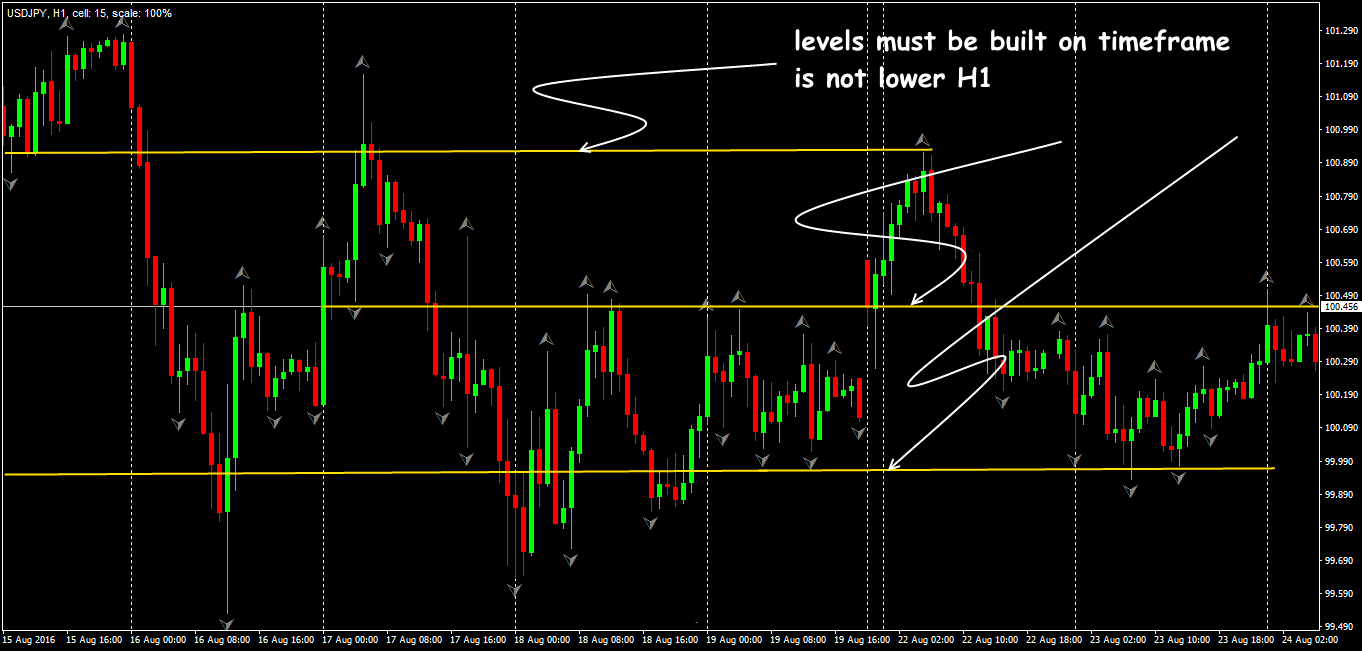
Top-Down Analysis With the Indicator
Because the Level Trading 123 Indicator functions across all timeframes, traders can perform full top-down technical analysis:
Identify the main trend on higher timeframes (Daily/Weekly).
Confirm trend direction on mid-timeframes (H4/H1).
Execute entries on lower timeframes (M30–M5).
This ensures alignment with the dominant market trend, increasing the probability of successful trades.
Why Traders Prefer the Level Trading 123 Indicator
Works for new and experienced traders
Clear visual signals
Accurate reversal zones
Reliable trend identification
Suitable for all chart timeframes
Can be combined with Price Action or indicators (RSI, MACD, Moving Averages)
Conclusion
The Level Trading 123 Indicator for MT4 is a powerful fractal-based indicator that helps traders spot BUY and SELL signals, trend reversals, and critical support and resistance zones. While the indicator performs well on its own, traders are encouraged to confirm signals using price action or complementary indicators—especially when trading breakouts and trend continuations.
You can download the indicator for free and install it on your MetaTrader 4 platform within minutes.
FAQ
7 Downloads
Published:
Dec 06, 2025 02:24 AM
Category: