Mastering Trend Geometry with Linear Regression Channels
In the fast-paced world of technical analysis, traders are constantly seeking tools that can filter out market noise and highlight the true direction of Price Action. While standard trendlines are subjective and prone to human error, Linear Regression Channels offer a mathematically precise way to visualize market equilibrium and volatility. This indicator is a staple for professional MetaTrader 4 (MT4) traders who prioritize data-driven decision-making over guesswork.
The Mathematics of Market Equilibrium
A Linear Regression Channel is built upon a "best-fit" line—a mathematical calculation that minimizes the distance between the line and every closing price within a specified period. This central line represents the market's equilibrium price. The channel is then completed by plotting two parallel lines above and below this center, typically at a distance of one or two standard deviations.
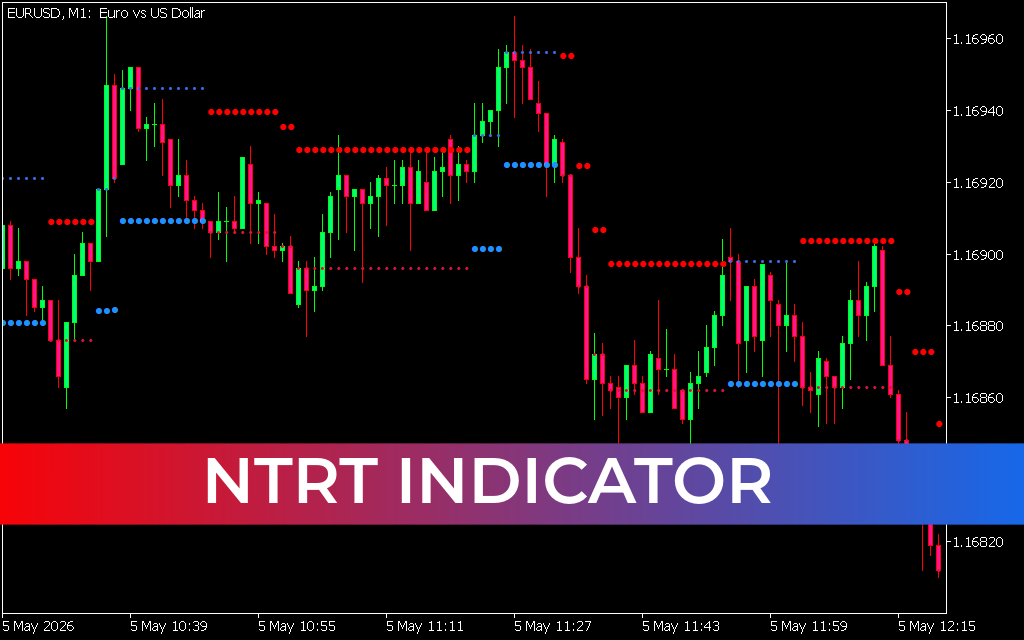
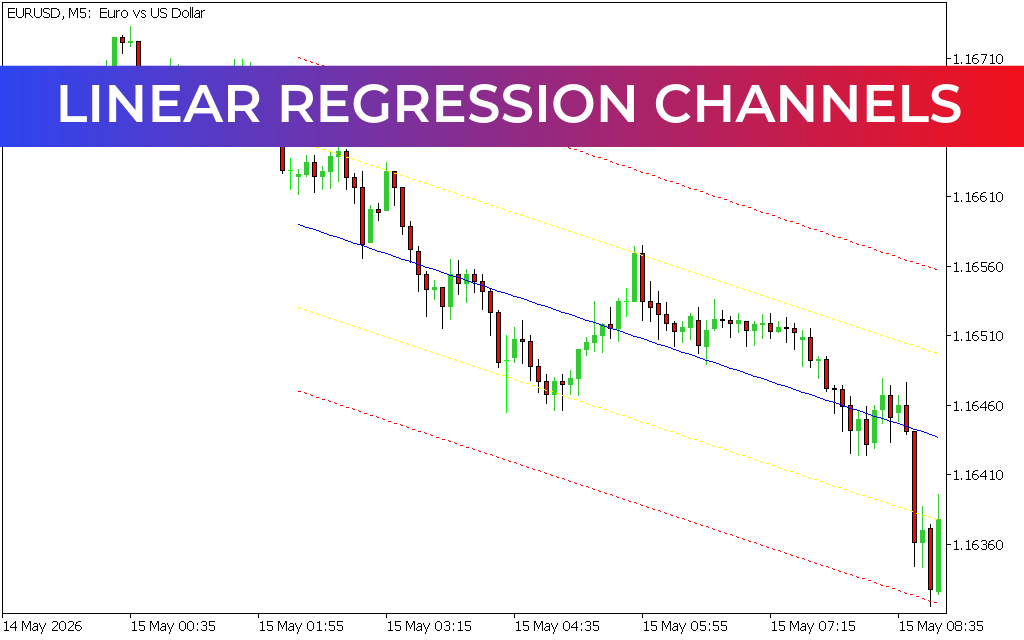
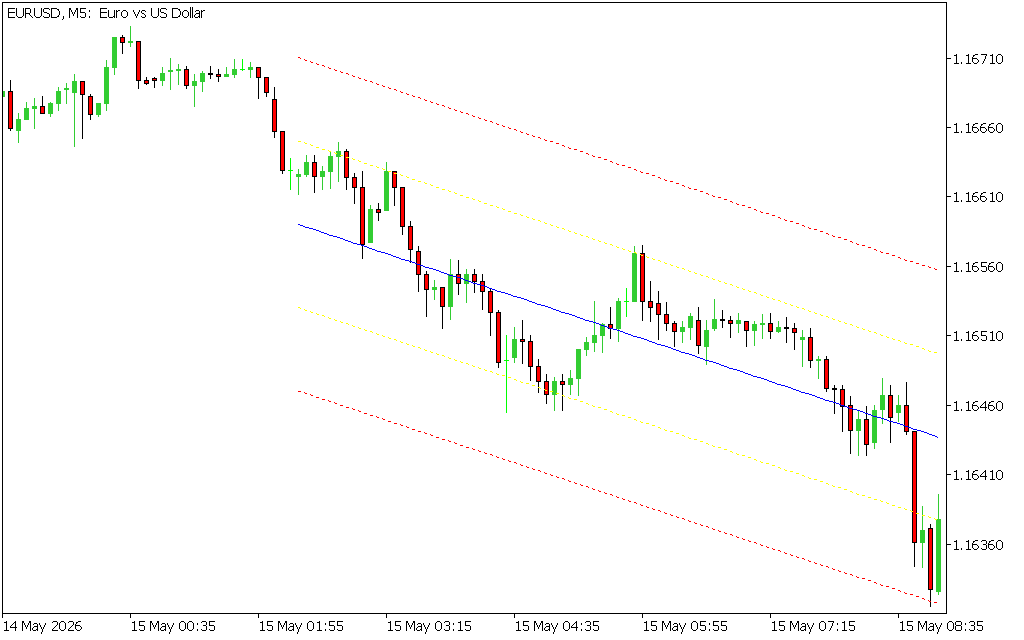
As illustrated in the EURUSD M5 chart, the channel provides a dynamic framework for price action:
- The Median Line (Blue): This is the core trend. When price is near this line, the market is in a state of relative balance.
- The Upper Channel (Red/Yellow): This zone represents an "overbought" or extreme bullish extension. It acts as a statistical ceiling where price is likely to exhaust and revert to the mean.
- The Lower Channel (Red/Yellow): This represents an "oversold" or extreme bearish extension. It serves as a statistical floor where demand typically resurfaces.
Strategic Trading Applications
The Linear Regression Channel is highly versatile, supporting both trend-following and mean-reversion strategies:
- Mean Reversion: Because price action is statistically likely to stay within the outer boundaries 95% of the time (at two standard deviations), traders look for reversal signals when price touches the outer red lines. A touch of the lower channel followed by a bullish candlestick pattern is a high-probability entry for a move back to the median.
- Trend Confirmation: The slope of the channel tells you everything you need to know about the current regime. An upward-sloping channel confirms a healthy bull market, while a downward slope signals a dominant bear trend.
- The Breakout Signal: When price closes outside of the Linear Regression Channel and stays there, it indicates a fundamental shift in market sentiment. This often precedes a "volatility expansion," signaling the start of a massive new trend.
Why Every Intraday Trader Needs This Tool
For scalpers and day traders working on M1 or M5 timeframes, the Linear Regression Channel acts as a crucial filter. It prevents traders from "chasing" a move that has already extended too far from the mathematical average. By providing clear visual boundaries based on standard deviation, it allows you to buy low and sell high with statistical confidence.
- Objective Analysis: Unlike hand-drawn lines, the channel remains perfectly consistent based on the price data provided.
- Dynamic Support And Resistance: The levels adjust automatically as new price data flows in, ensuring your "map" of the market is always current.
- Volatility Awareness: The width of the channel expands and contracts based on market volatility, helping you adjust your stop-loss and take-profit targets accordingly.
1 Download
Last Update:
May 15, 2026 16:56 PM
Published:
Jan 21, 2026 18:49 PM
Category: