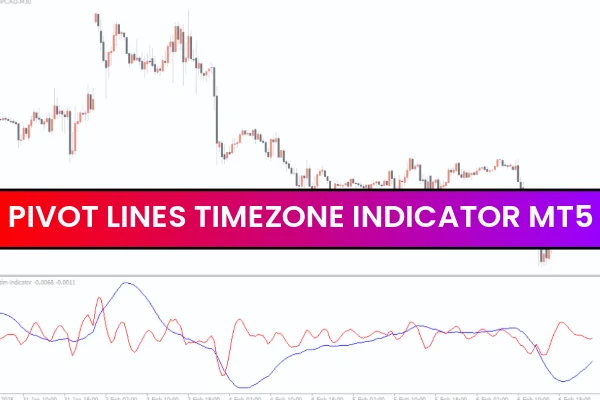
The Pivot Lines TimeZone Indicator for MT4 is a powerful tool for traders looking to analyze market trends and Price Action. It calculates and plots daily highs, lows, open and close prices, and range levels, giving a clear view of the current day’s trend and the previous day’s price action. While it does not generate direct buy or sell signals on its own, it is a vital tool for trend analysis, support/resistance detection, and trade planning.
Traders often combine the Pivot Lines TimeZone Indicator with momentum oscillators like RSI or MACD to define buy and sell signals more accurately. This approach allows traders to incorporate pivot points as part of their overall trading strategy and improves decision-making in volatile markets.
How the Pivot Lines TimeZone Indicator Works
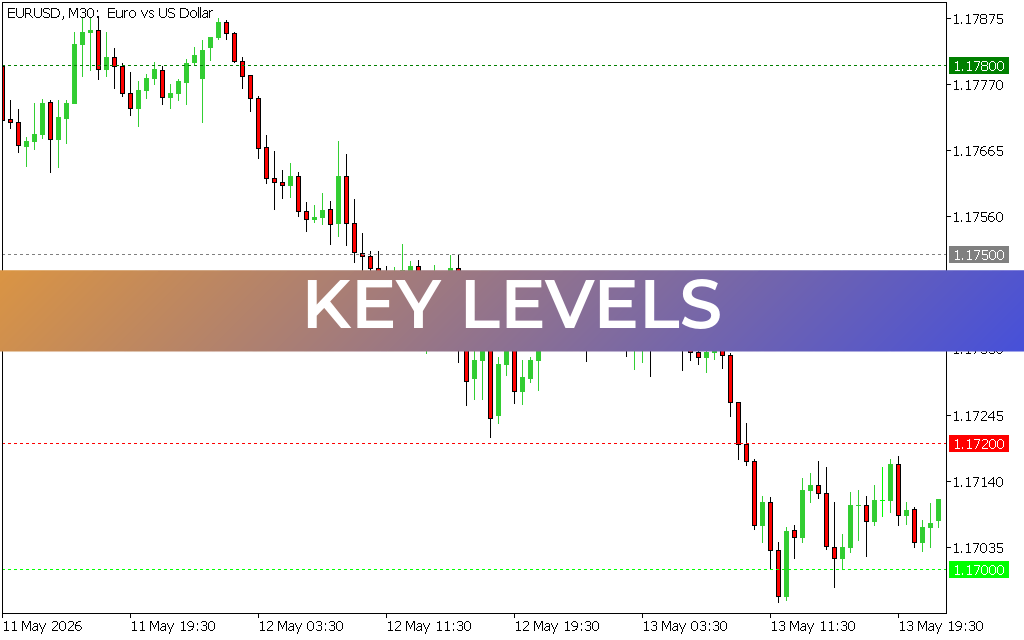
The indicator calculates pivot points and reference lines based on the previous day’s highs, lows, and closing prices. It then projects these levels onto the current trading session.
Daily Highs and Lows: Identify strong market Support And Resistance levels.
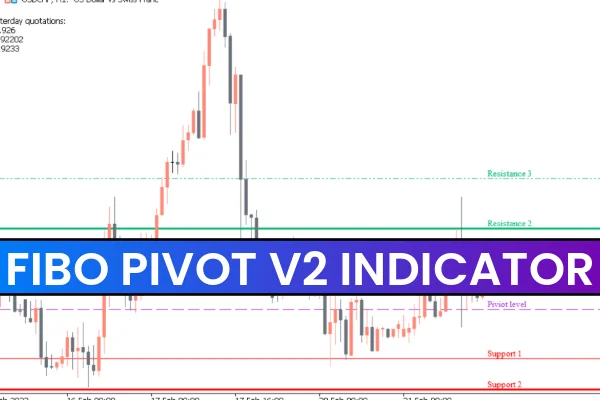
Pivot Levels: Help forecast the potential direction of price movement.
Camarilla Points and Midpoints: Offer additional reference levels for swing and intraday traders.
By visually displaying these levels, traders can quickly assess the strength of the trend and anticipate potential reversals or breakout zones.
Using Pivot Lines TimeZone Indicator for Trading
Although the Pivot Lines TimeZone Indicator does not directly provide buy or sell signals, it can be combined with other indicators to make precise trading decisions:
Support and Resistance Strategy: Pivot levels act as key support and resistance points. Price bouncing off these levels may indicate a potential trend continuation.
Trend Confirmation: Compare current price movements with pivot levels to gauge the overall trend.
Combining with Oscillators: Use indicators like RSI, MACD, or Stochastic to confirm entry and exit points alongside pivot levels.
For example, if the price reaches a pivot support level and the RSI shows oversold conditions, traders may consider entering a long position. Conversely, a pivot resistance level combined with an overbought signal may indicate a shorting opportunity.
Why Pivot Lines Are Important
Daily Market Overview: The indicator provides an instant snapshot of the current and previous day’s market trends, including high, low, open, and close prices.
Visual Clarity: Pivot levels and reference lines help traders clearly identify potential reversal points.
Multi-Timeframe Compatibility: While it works on all timeframes, using higher timeframes improves accuracy for swing and trend trading.
Pivot points are widely regarded as reliable tools for intraday and swing traders because they highlight key price levels that many market participants monitor.
Conclusion
The Pivot Lines TimeZone Indicator for MT4 is a versatile tool for trend analysis and support/resistance identification. While it does not provide direct buy or sell signals, it becomes highly effective when combined with momentum indicators like RSI or MACD. Traders can use it to monitor daily highs and lows, pivot levels, and range zones for better decision-making.
You can download the Pivot Lines TimeZone Indicator for free at IndicatorForest.com and integrate it into your trading strategy to improve market insights and trading accuracy.
FAQ
1 Download
Published:
Dec 10, 2025 22:57 PM
Category: