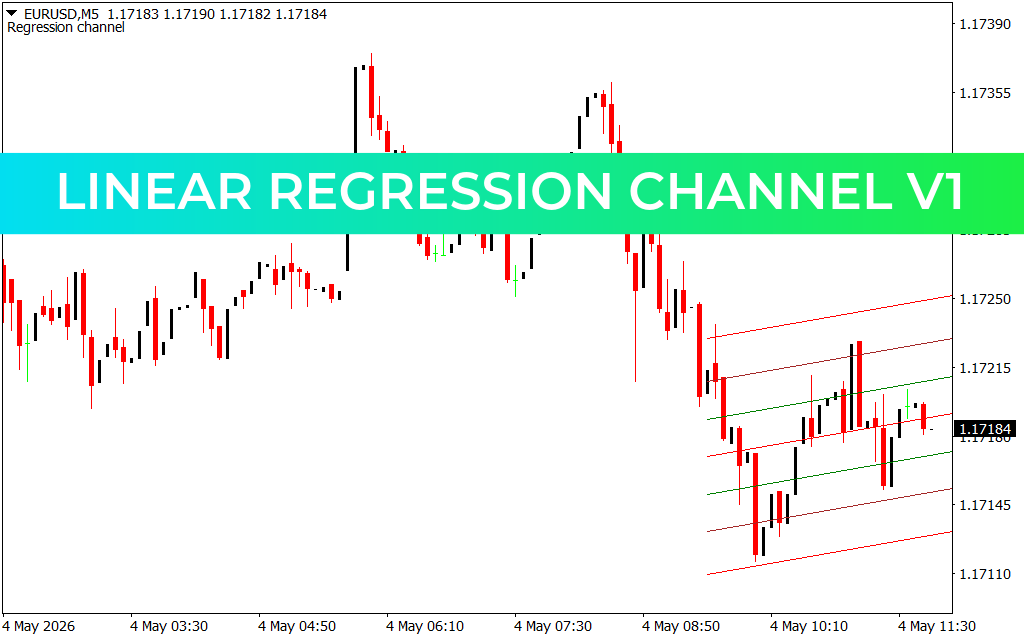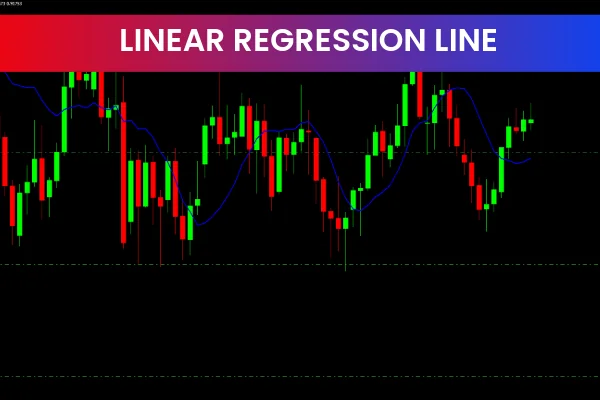
The Linear Regression Line Forex Indicator is a popular and free MT4 Forex indicator designed to help traders identify trend direction, trend strength, and potential Support And Resistance levels. By plotting a statistically calculated straight line on the price chart, this indicator provides a clear and objective view of market behavior, making it easier for traders to make informed decisions.
This indicator is widely used by beginners and professional traders because of its simplicity, accuracy, and versatility across different market conditions and timeframes.
What Is the Linear Regression Line Indicator
The Linear Regression Line indicator is based on the mathematical concept of linear regression, which determines the best-fit line for a set of price data points. This line represents the average price movement over a specific period and helps traders visualize the overall market trend.
Unlike standard moving averages, the linear regression line focuses on trend direction and slope, making it highly effective for identifying Trend Strength and potential market turning points.
How the Linear Regression Line Forex Indicator Works
The indicator plots a straight line that best fits historical price data. Traders can interpret the line in several ways:
Upward-sloping line: Indicates a bullish trend
Downward-sloping line: Indicates a bearish trend
Flat line: Indicates a ranging or sideways market
Price interaction with the regression line can also highlight dynamic support and resistance levels, offering valuable insights for trade entries and exits.
Key Features of the Linear Regression Line Forex Indicator
Identifies trend direction clearly
Measures trend strength through line slope
Highlights dynamic support and resistance levels
Works on all currency pairs
Compatible with all MT4 timeframes
Free and easy to install
Benefits of Using the Linear Regression Line Indicator
Clear Trend Identification: Helps traders trade in the direction of the dominant market trend
Objective Analysis: Reduces emotional trading by relying on mathematical calculations
Support and Resistance Levels: Assists in identifying price reaction zones
Improved Trade Timing: Enhances entry and exit precision
Versatility: Suitable for Scalping, intraday trading, and swing trading
Trading Strategies Using the Linear Regression Line Indicator
Trend-Following Strategy
Enter buy trades when price stays above an upward-sloping regression line
Enter sell trades when price stays below a downward-sloping regression line
Exit trades when price breaks and closes on the opposite side of the line
Support and Resistance Strategy
Look for buying opportunities when price pulls back toward the regression line in an uptrend
Look for selling opportunities when price retraces toward the regression line in a downtrend
Combine with candlestick patterns for confirmation
Multi-Timeframe Strategy
Use higher timeframes (H4 or D1) to identify the main trend
Use lower timeframes (M15 or H1) to fine-tune entries
Trade only in the direction of the higher-timeframe regression line
Best Timeframes to Use
The Linear Regression Line Forex Indicator works well on all timeframes:
M5–M15: Scalping
M30–H1: Intraday trading
H4–D1: Swing and position trading
Higher timeframes generally provide stronger and more reliable trend signals.
Ease of Use
This indicator is simple to install and use on the MT4 platform. Its clean visual design makes it easy to interpret, even for traders who are new to technical analysis.
Final Thoughts
The Linear Regression Line Forex Indicator for MT4 is a powerful yet simple tool for identifying trend direction, trend strength, and key support and resistance levels. By incorporating this indicator into your trading strategy, you can improve trade accuracy and confidence.
👉 Visit IndicatorForest.com to download this indicator for free and explore more professional MT4 trading tools.
Published:
Dec 29, 2025 11:20 AM
Category: