The Linear Regression Slope Indicator is a popular and free Forex Indicator for the MetaTrader 4 (MT4) platform. It helps traders measure the strength of current price moves and market momentum, providing valuable insights for finding optimal trading opportunities.

The indicator is simple, easy to read, and suitable for all levels of traders, from beginners to professionals.
How the Linear Regression Slope Indicator Works
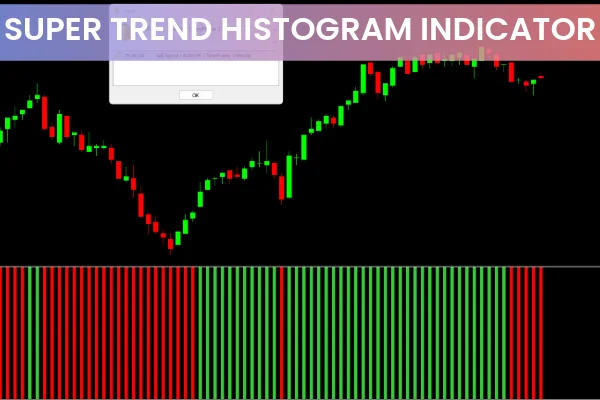
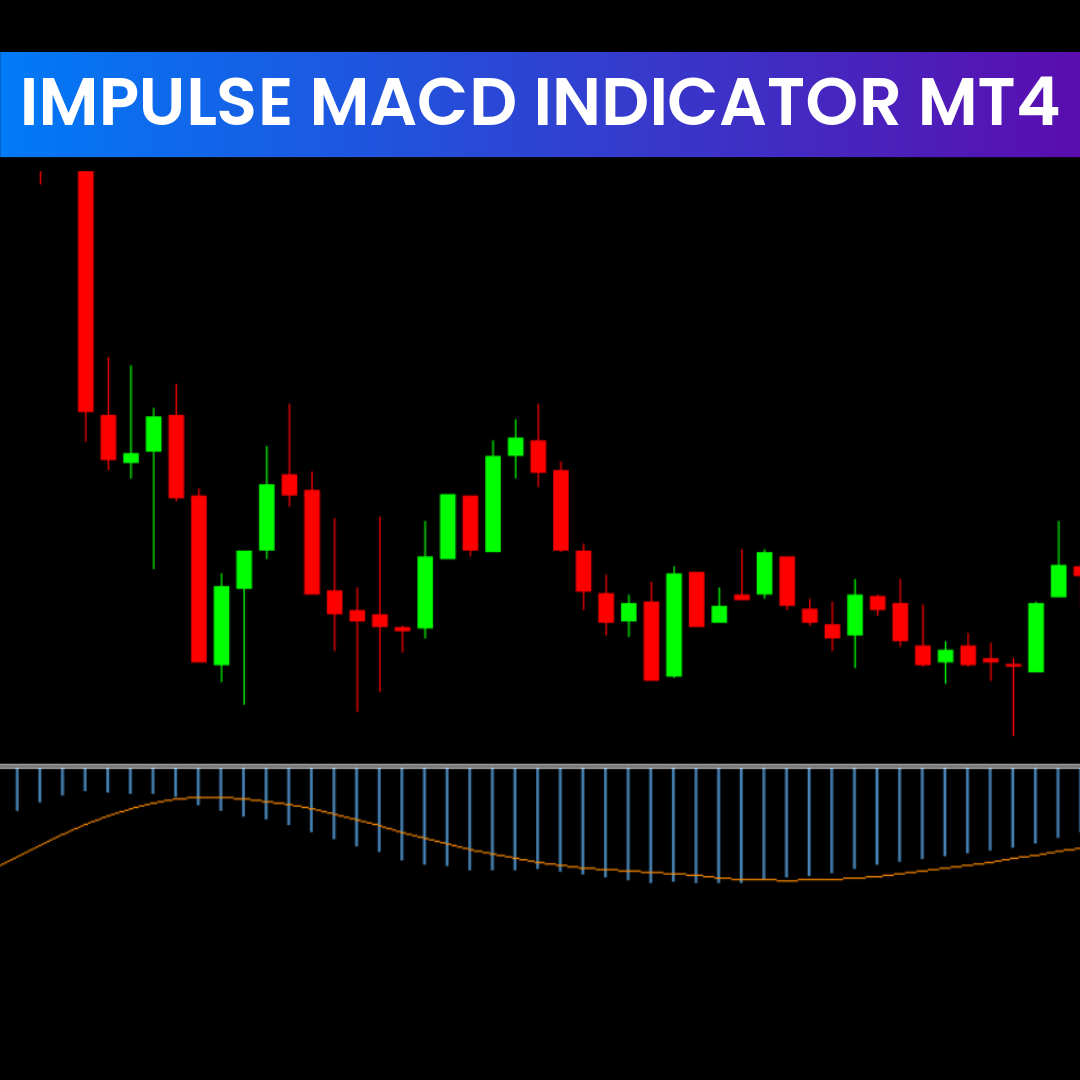
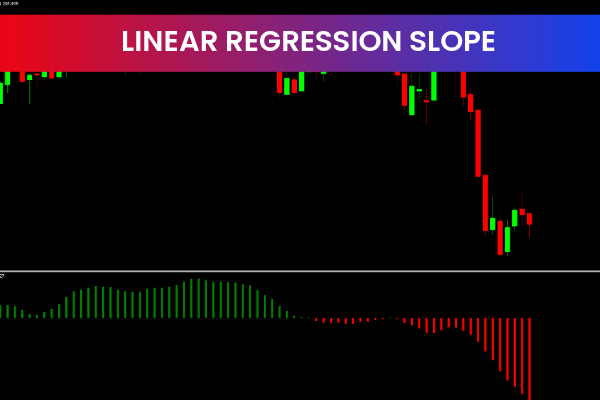
The Linear Regression Slope Indicator displays histogram bars below the price chart to visualize market momentum:
Green bars above zero → bullish momentum
Red bars below zero → bearish momentum
Short bars → weak trend, low momentum
Long bars → strong trend, high momentum
The length and color of the bars make it easy to determine the strength and direction of the current trend at a glance.
Key Features of the Linear Regression Slope Indicator
Visualizes market momentum clearly using histogram bars
Identifies Trend Strength with color-coded bars
Provides potential buy and sell signals based on zero line crossovers
Simple setup and easy to use for all trader levels
Compatible with MT4 and all Forex currency pairs
How the Indicator Can Benefit You
Buy Signals
Enter a buy trade when the histogram bars cross above zero and turn green
Hold the position until bars shorten or cross back below zero
Sell Signals
Enter a sell trade when bars cross below zero and turn red
Maintain the position until bars rise back above zero
Trend Filtering
To reduce false signals, combine the Linear Regression Slope Indicator with trend-identifying tools:
In an uptrend, only take buy signals (wait for red bars to turn green)
In a downtrend, only take sell signals (wait for green bars to turn red)
This ensures trades align with the main trend and filters out minor pullbacks.
Benefits of Using the Linear Regression Slope Indicator
Measures momentum and trend strength accurately
Provides early entry and exit signals
Helps avoid counter-trend trades
Visual and beginner-friendly
Enhances decision-making when combined with other trend tools
Trading Strategies Using Linear Regression Slope Indicator
Trend-Aligned Momentum Trading
Trade in the direction of the main trend using histogram signals
Confirm trend with moving averages or trendlines
Momentum Reversal Strategy
Watch for shortening bars to anticipate momentum loss and potential reversals
Combine with support/resistance levels for higher-probability trades
Pullback Filtering
Use the indicator to avoid entering trades on temporary corrections
Enter only when bars align with the overall trend
Best Practices
Combine with trend indicators for higher accuracy
Apply stop-loss and take-profit levels near support/resistance zones
Use multiple timeframes to confirm trend strength
Avoid trading solely based on short bars near zero
Educational resources such as Investopedia and BabyPips provide detailed insights on trend momentum and oscillator-based strategies.
Why Traders Use the Linear Regression Slope Indicator
The Linear Regression Slope Indicator is valued for its clear visual representation of trend strength and momentum. By combining histogram length and color, traders can quickly assess market conditions and make informed decisions, reducing the risk of entering counter-trend trades.
Its simplicity, effectiveness, and free availability on MT4 make it an essential tool for Forex trading.
Improve Your Trading with Linear Regression Slope Indicator
If you want a reliable MT4 indicator to measure momentum, spot strong trends, and time buy or sell entries, the Linear Regression Slope Indicator is an excellent addition to your trading toolkit.
👉 Visit IndicatorForest.com to download the Linear Regression Slope Indicator and explore more free professional MT4 tools.
6 Downloads
Published:
Dec 24, 2025 19:46 PM
Category: