Trade the Footprints of Market Makers with the Liquidity Trading Indicator
In the modern financial markets, traditional retail technical analysis strategies—such as trading basic Support And Resistance line bounces—frequently result in stopped-out accounts. Smart money players, major institutional banks, and algorithmic market makers do not look at retail chart setups the same way. Instead, they drive price action toward areas of high liquidity, creating sudden "stop hunts" or false breakouts to fill their massive block orders.
Traders who fail to track these institutional stop zones often find themselves caught on the wrong side of sharp trend reversals. The Liquidity Trading Indicator is a sophisticated algorithmic workspace upgrade engineered to reveal these hidden institutional pools, turning market traps into highly accurate trade setups.
Understanding Institutional Liquidity Maps
When scalping or day trading lower intervals like the 1-minute ($M1$) chart, Price Action can appear completely random and highly chaotic. The Liquidity Trading Indicator strips away this visual noise by actively monitoring order flow imbalances and identifying major historical price levels where stops are tightly clustered.
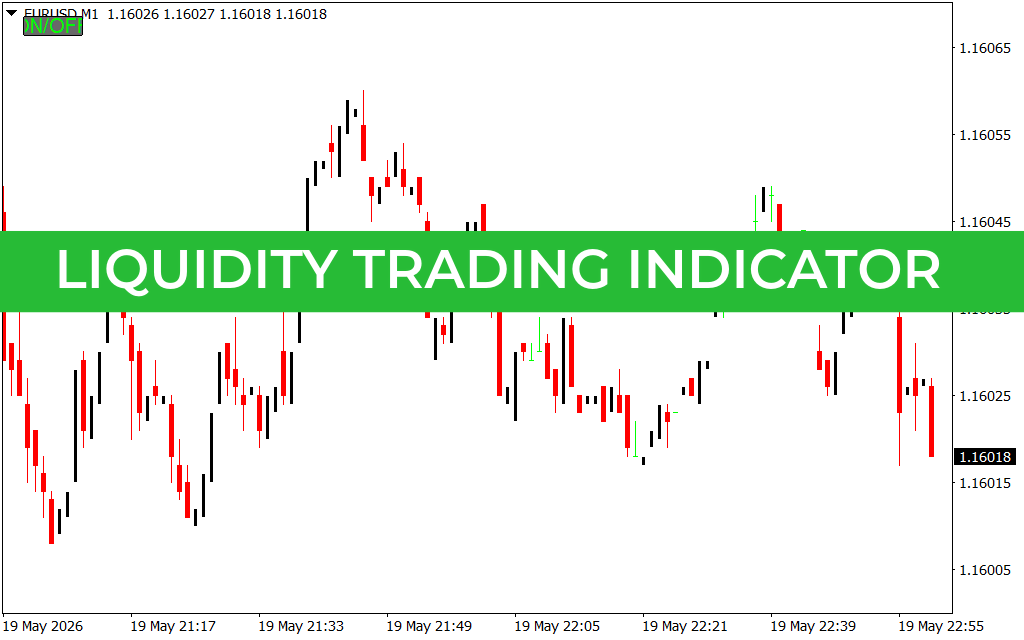
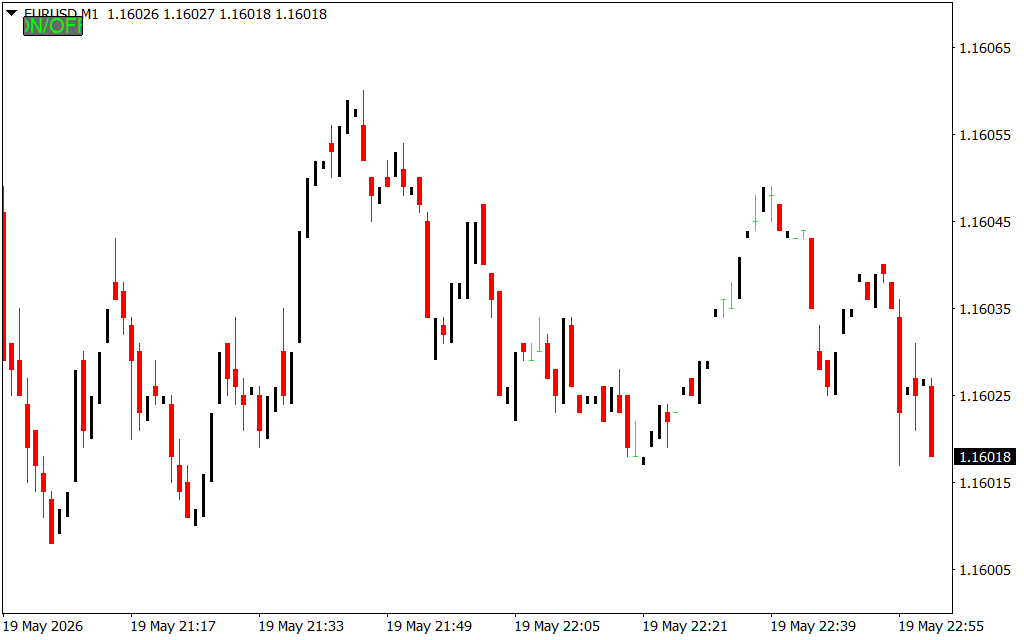
As displayed on the $M1$ EUR/USD workspace, the software features a clean, highly adaptive design template built for real-time order-flow execution:
- Real-Time Interface Interactivity: The indicator implements a clean, interactive ON/OFF interactive toggle switch right on your primary MetaTrader canvas. This allows technical analysts to instantly hide or show institutional key levels with a single click, keeping charts uncluttered during intensive multi-asset analysis.
- Smart Money Stop Mapping: Rather than drawing arbitrary lagging lines, the underlying algorithm identifies major swing high and swing low zones where liquidity is heavily concentrated. It highlights the exact inflection points where retail traders place protective stop-losses, giving you a precise visual map of potential institutional target zones.
Executing Rule-Based Smart Money Strategies
Integrating the institutional visual cues of the Liquidity Trading Indicator into your trading rules eliminates emotional guesswork, delivering an objective execution plan.
1. Trading the Liquidity Sweep (Stop Hunt Rejection)
The most profitable setup occurs when price aggressively spikes past a known structural level, sweeping retail stop-losses, and then immediately snaps back into the previous range. When the indicator highlights a fresh Liquidity Grab on the $M1$ chart followed by a strong rejection candlestick, it confirms that institutions have filled their block orders. This provides a low-risk opportunity to execute a reversal position alongside smart money order flow.
2. Filtering High-Probability Breakouts
Not all breakouts are fakeouts. When an asset approaches a major liquidity zone accompanied by massive institutional volume, price will push completely through the level without rejecting. By tracking how price reacts right at the indicator's plotted boundaries, day traders can easily distinguish between a low-volume stop hunt trap and a true, high-velocity breakout continuation.
Conclusion
The Liquidity Trading Indicator is a vital tool for any technical trader shifting away from retail strategies toward institutional price action. By converting order flow dynamics into highly practical visual levels, it helps you anticipate market maker movements before they occur. Download the Liquidity Trading Indicator today to upgrade your MetaTrader terminal and start trading with an institutional edge.
4 Downloads
Last Update:
May 20, 2026 02:14 AM
Published:
Jan 19, 2026 07:42 AM
Category: