Master Market Trends with the LSMA Channel Indicator
In the fast-paced world of technical analysis, traders are constantly searching for tools that provide a balance between sensitivity and stability. Traditional moving averages often suffer from significant lag, while standard trend lines can be subjective. Enter the LSMA Channel (Least Squares Moving Average Channel)—a sophisticated technical indicator designed to provide a mathematical edge in identifying market direction and potential reversal zones.
What is the LSMA Channel?
The LSMA Channel is built upon the foundation of Linear Regression. Unlike a simple moving average that calculates the mean price over a period, the LSMA calculates the "line of best fit" for the Price Action. This mathematical approach allows the indicator to react faster to price changes while maintaining a smooth trajectory.
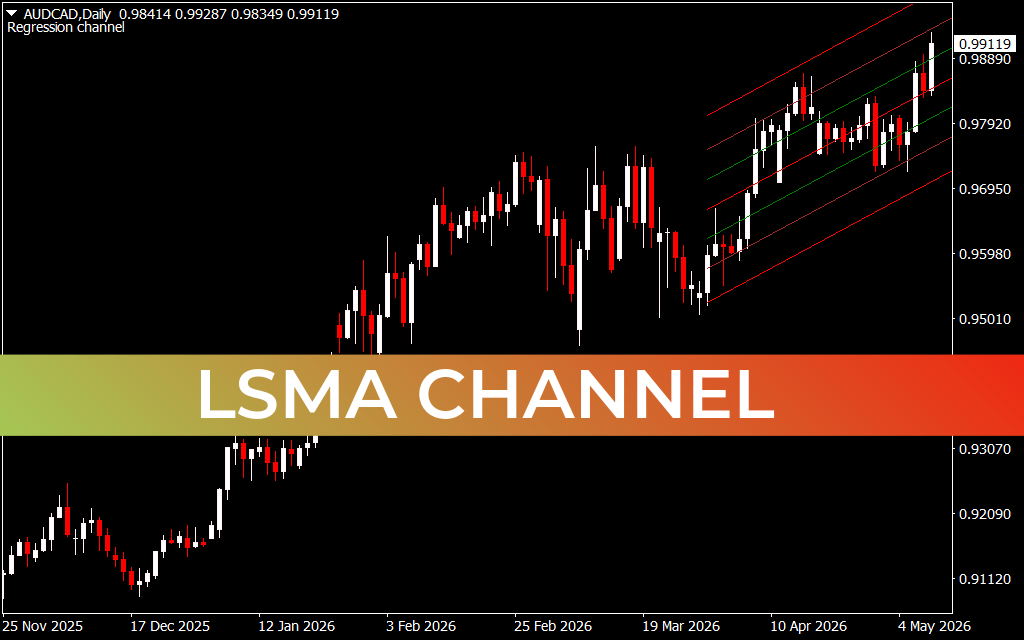
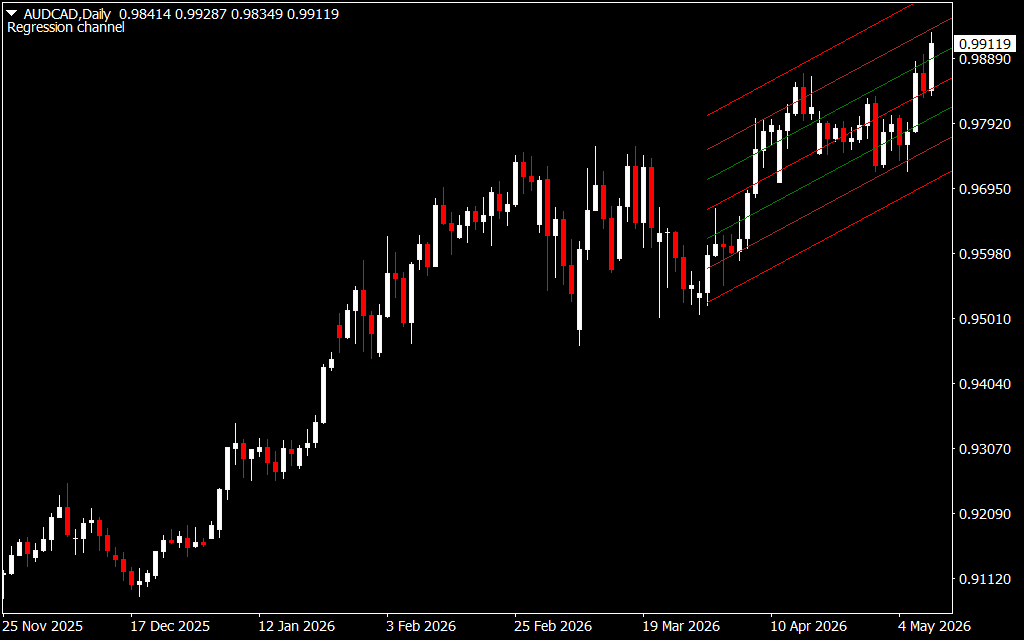
The "Channel" aspect adds layers of volatility awareness. By projecting standard deviation bands—or in the case of the provided AUD/CAD daily chart, a regression-based linear channel—traders can visualize the fair value of an asset versus its overextended extremes.
Key Trading Strategies with LSMA Channels
- Trend Riding: When the LSMA Channel is sloping upward and price action remains supported by the lower or middle bands, the market is in a confirmed bullish phase. Traders look for "buy the dip" opportunities at the channel's baseline.
- Mean Reversion: Markets rarely move in a straight line. When price pierces the outer red bands (as seen in the recent May 2026 data), it is often considered "overbought" or "oversold." This signals a high probability of price returning to the center of the channel.
- Breakout Detection: A sharp candle closing outside the linear regression channel often signals a volatility expansion. If the LSMA slope shifts abruptly, it can be the earliest warning of a new macro trend.
Why Use the LSMA Channel on Daily Charts?
As seen in the AUD/CAD analysis, the LSMA Channel excels at filtering out daily "noise." By using a regression-based model, the indicator ignores minor price spikes that would otherwise skew a traditional moving average. This provides a clearer picture of the institutional trend, allowing retail traders to align themselves with big-market movers.
For traders using MetaTrader or similar platforms, the LSMA Channel is a must-have for visual clarity. It turns a chaotic price chart into a structured map, showing exactly where the price has been and the most statistically likely path it will take next. Whether you are Scalping or position trading, this indicator brings mathematical precision to your decision-making process.
1 Download
Last Update:
May 10, 2026 02:21 AM
Published:
Jan 24, 2026 15:24 PM
Category: