Mastering Trend Dynamics with the LSMA Channel Indicator
In technical analysis, the "mean" is the gravitational center of Price Action. While standard moving averages provide a basic look at past prices, they often suffer from significant lag. The LSMA Channel Indicator (Least Squares Moving Average) solves this by using linear regression to calculate where price "should" be based on its current trajectory. By wrapping this logic into a multi-layered channel, it provides traders with a complete roadmap of trend direction, volatility, and potential reversal points.
What is the LSMA Channel?
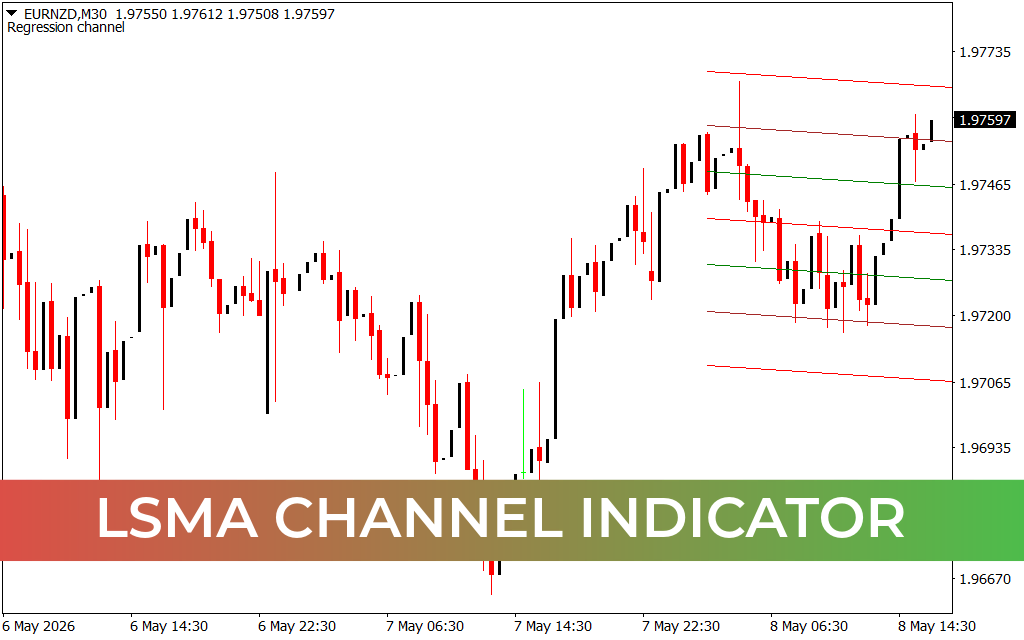
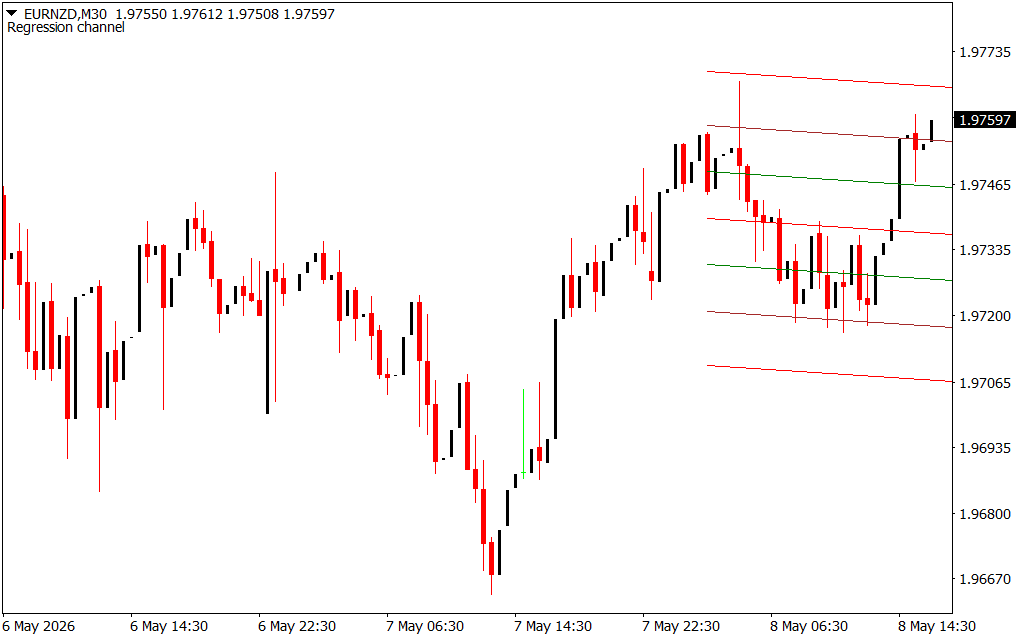
Unlike a standard trend channel drawn manually, the LSMA Channel is a dynamic mathematical model. It consists of a central regression line and multiple parallel outer bands. These bands represent standard deviations or fixed offsets from the mathematical mean. When price is within the center of the channel, the trend is considered stable. When price touches the outer red or green lines, it indicates a statistical extreme—suggesting the market is either overbought or oversold relative to its current momentum.
Strategic Benefits for MT4 Traders
- Mathematical Precision: Because the channel is based on the "least squares" method, it provides a much more accurate fit to current price data than simple moving averages.
- Dynamic Support And Resistance: The outer lines of the LSMA Channel act as flexible support and resistance levels. As seen on the M30 chart, price often "bounces" off the outer boundaries as it regresses back to the mean.
- Trend Strength Visualization: The slope of the channel tells you everything you need to know about trend intensity. A steep upward slope confirms a strong bullish regime, while a flattening channel warns of an impending consolidation or reversal.
- Volatility Filtering: During periods of high market noise, the width of the channel expands. This helps traders stay out of low-probability setups and focus on trades where the reward-to-risk ratio is highest.
How to Trade with the LSMA Channel
The most effective way to utilize this indicator is to trade the Mean Reversion strategy. When price reaches the outermost red line and begins to show rejection (long wicks), traders look for a move back toward the central green line.
Conversely, for trend-following strategies, traders wait for a candle to close outside the channel during a high-volatility breakout. This signals that the market is entering a new phase of price discovery. On timeframes like M30 or H1, the LSMA Channel is an invaluable tool for identifying the "value area" and ensuring you never buy at the very top of a move.
Whether you are a scalper looking for quick pips at the boundaries or a swing trader following the regression slope, the LSMA Channel Indicator provides the statistical edge needed to navigate volatile Forex markets with confidence.
3 Downloads
Last Update:
May 08, 2026 19:55 PM
Published:
Jan 25, 2026 21:31 PM
Category: