Spot Hidden Market Turning Points with the Average Delta RSI Indicator
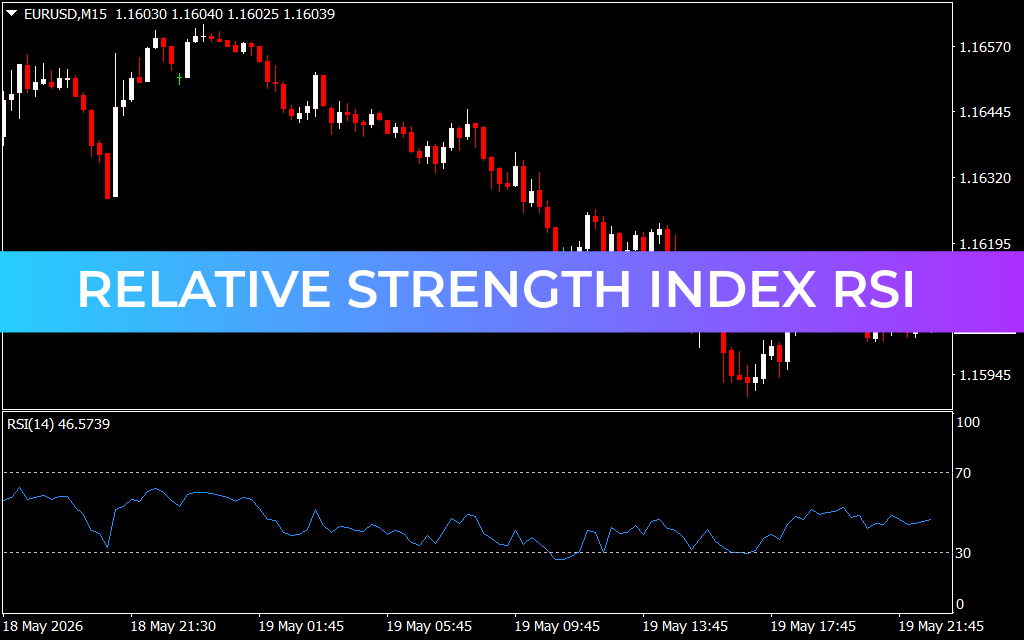
The standard Relative Strength Index (RSI) has been a cornerstone of technical analysis for decades. However, in today’s highly algorithmic trading environment, traditional overbought and oversold metrics frequently fall flat. In strong trending markets, a standard RSI can remain trapped in extreme zones for long periods, leading retail traders to repeatedly fight the trend and face severe losses.
The Average Delta RSI indicator redefines this classic momentum formula. By shifting the focus from absolute price levels to the rate of change—or delta—of momentum, this advanced oscillator delivers a smoother, highly responsive view of market velocity.
What is the Average Delta RSI?
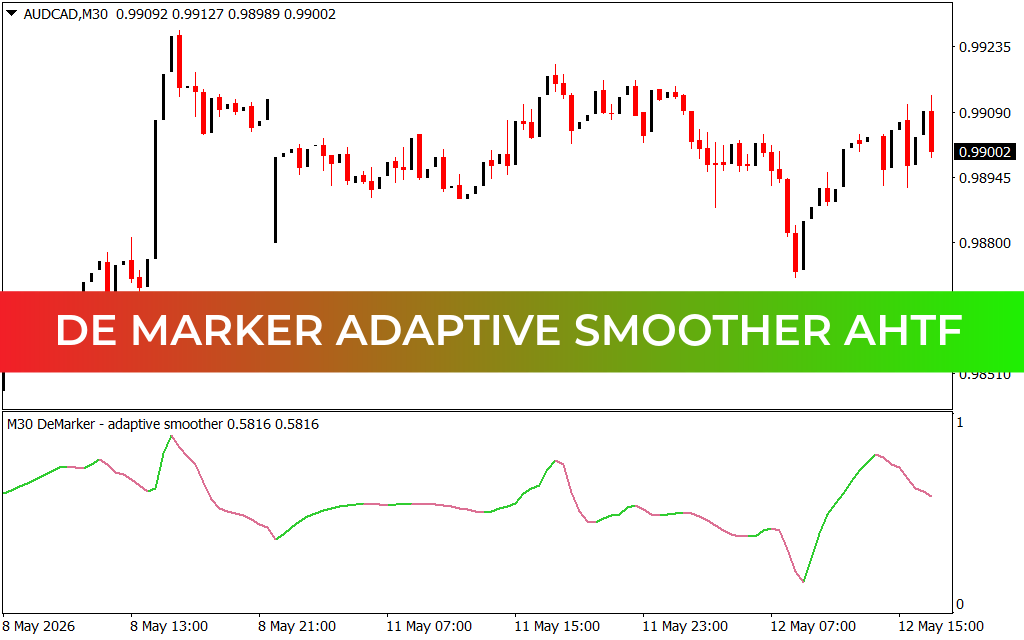
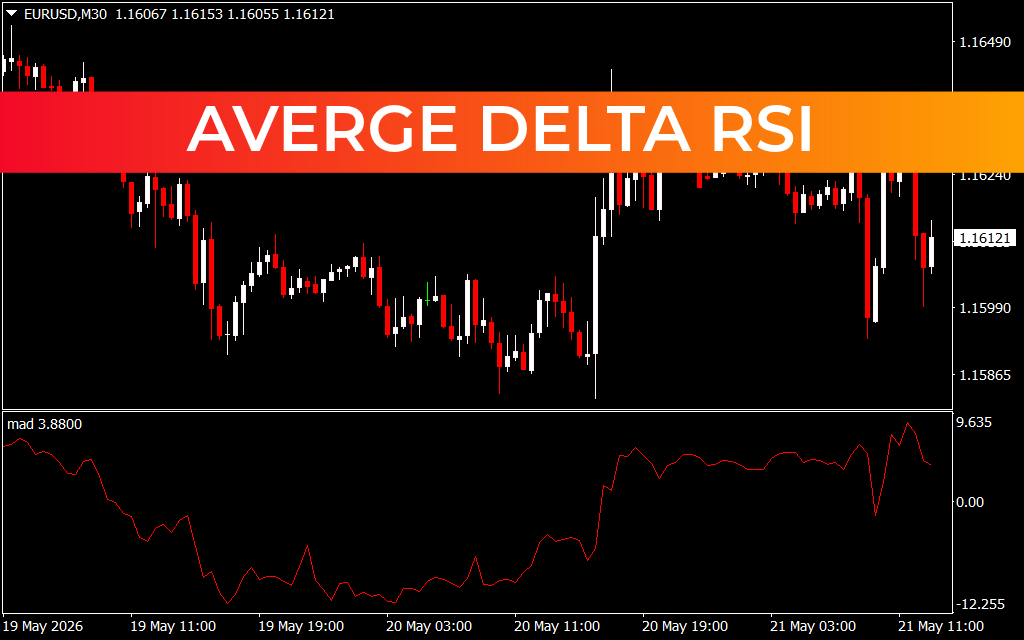
The Average Delta RSI is a modern technical tool engineered to isolate true market momentum from erratic day-to-day price noise. Instead of merely tracking where the current price sits relative to its historical range, this indicator measures the mathematical difference (the delta) between consecutive RSI calculations, smoothed out by an underlying averaging filter.
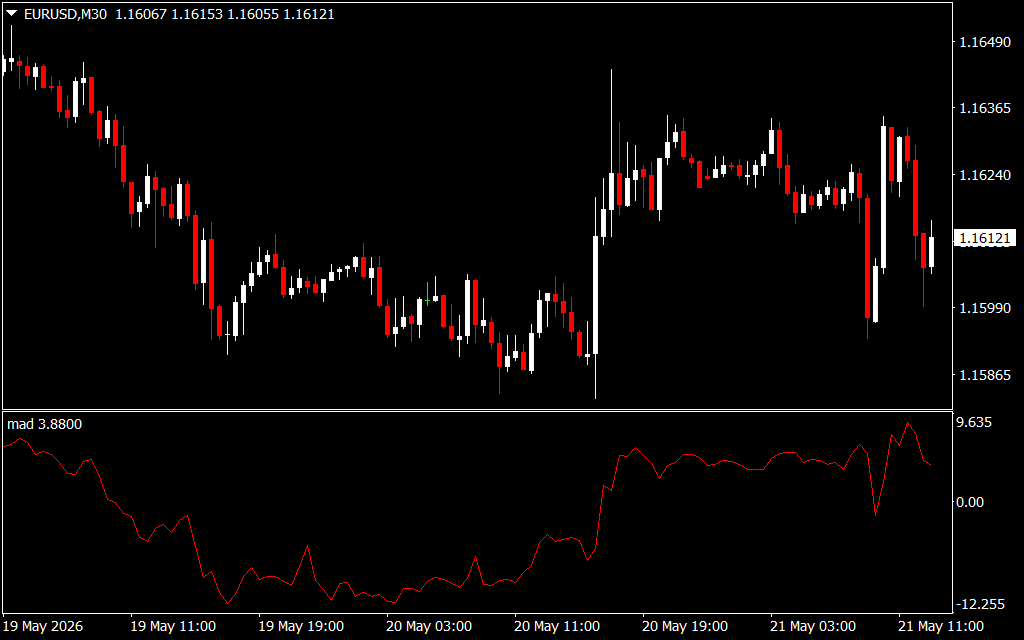
The result is a clean oscillator line plotted beneath your main chart. It oscillates around a central zero line, transforming raw, choppy momentum into structural waves. When the line crosses above or below key thresholds, it reveals exactly when big market participants are stepping on the gas or hitting the brakes.
Key Features and Strategic Advantages
- Advanced Noise Suppression: The unique averaging logic eliminates the minor spikes and false turns that plague traditional oscillators, keeping you focused on the true trend direction.
- Precision Zero-Line Crossings: The central zero baseline serves as a highly accurate trend pivot. Crossings provide immediate confirmation of momentum shifts between bulls and bears.
- Early Divergence Detection: Spot sharp disagreements between the indicator's peaks and the chart's price highs, giving you an early warning of impending institutional reversals.
- Universal Application: Whether you are day trading major Forex pairs like EUR/USD on the M30 chart or tracking long-term trends on daily equity frames, the indicator retains structural accuracy.
How to Trade with Average Delta RSI
Integrating this optimized momentum tool into your trading framework enhances your execution clarity:
1. Momentum Breakout Strategy
When the Average Delta RSI line breaks cleanly out of its lower consolidation zone and crosses above the zero line, it signals an aggressive influx of buying momentum. Traders can use this crossover as a mechanical trigger to enter long positions early in a new structural cycle.
2. Spotting Hidden Exhaustion
If the price of an asset continues to trend lower, making lower lows, but the Average Delta RSI prints a clear higher low, it signals a bullish divergence. The selling pressure is mathematically drying up, warning short-sellers to take profits and buyers to prepare for a powerful upside bounce.
3. Filtering False Reversals
In a strong uptrend, standard oscillators quickly become overbought, tempting traders to short prematurely. The Average Delta RSI protects your capital by staying structurally buoyant above the zero line until a true, volume-backed shift occurs.
Conclusion
Relying on outdated indicators in modern markets leaves you a step behind institutional algorithms. By shifting your focus to the smoothed momentum differentials provided by the Average Delta RSI, you unlock a clearer view of Supply And Demand dynamics. Download the indicator today to trade trend reversals with absolute analytical precision.
1 Download
Last Update:
May 21, 2026 16:31 PM
Published:
Jan 17, 2026 20:12 PM
Category: