Master Institutional Price Levels with the M Fibonacci Indicator for MT4
In the mathematical architecture of the financial markets, few concepts carry as much weight as the Fibonacci sequence. While many retail traders struggle to manually draw retracement levels on fluctuating charts, professional market participants utilize automated tools to identify institutional "hidden" Support And Resistance. The M Fibonacci Indicator for MetaTrader 4 (MT4) is a premier technical solution that automates the plotting of Fibonacci levels, allowing traders to identify high-probability reversal zones and profit targets with absolute mathematical precision.
The Strategic Edge of Automated Fibonacci Mapping
Fibonacci levels are not just arbitrary lines; they represent the collective psychology of market participants and the programmed logic of institutional trading algorithms. The M Fibonacci Indicator takes this complex calculation and applies it dynamically to your Price Action, ensuring you are always aligned with the most relevant structural data.
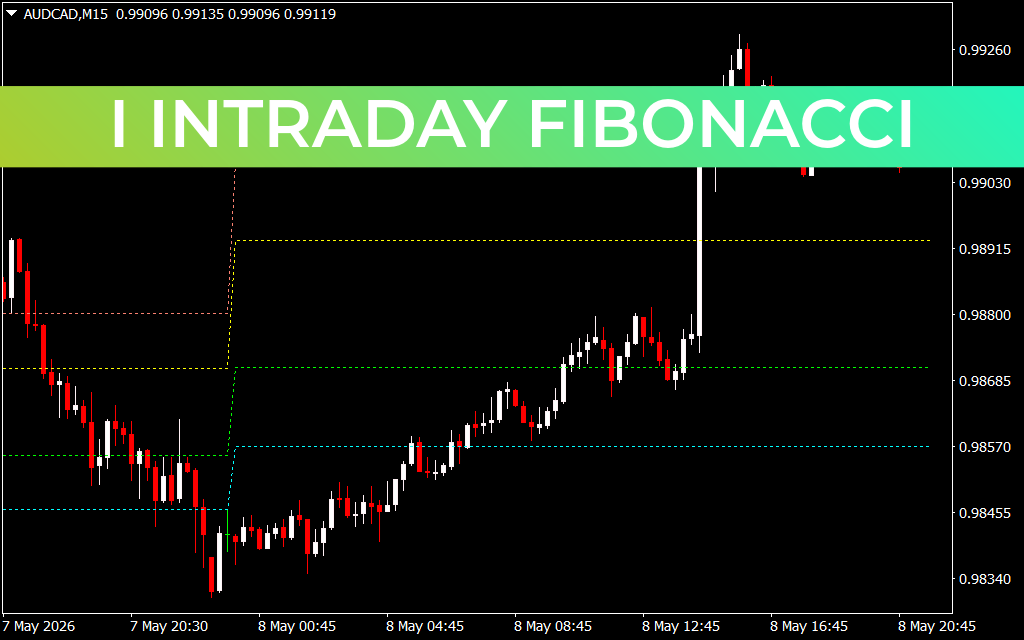
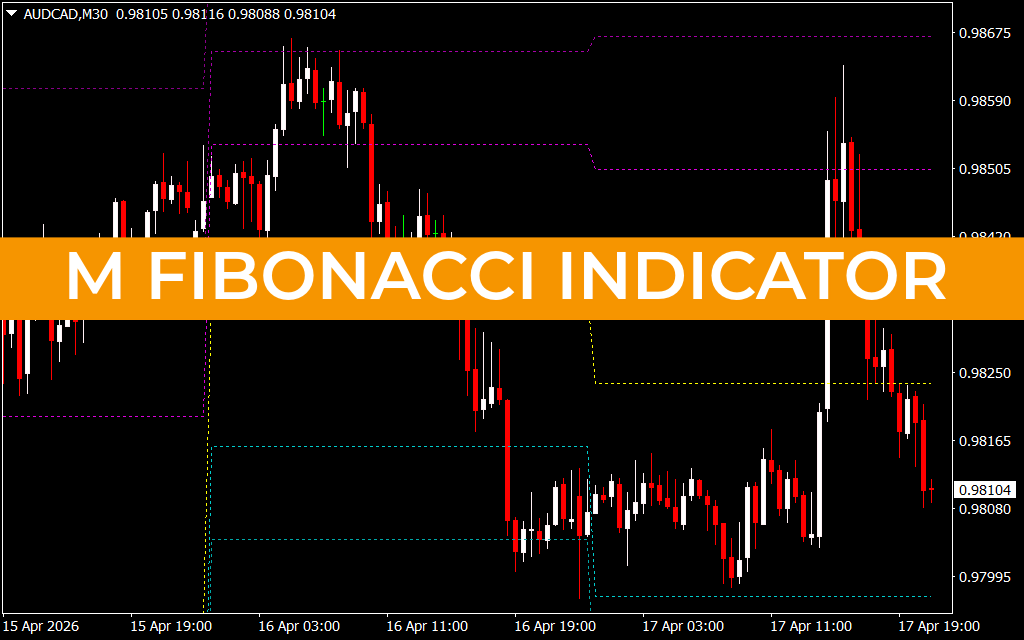
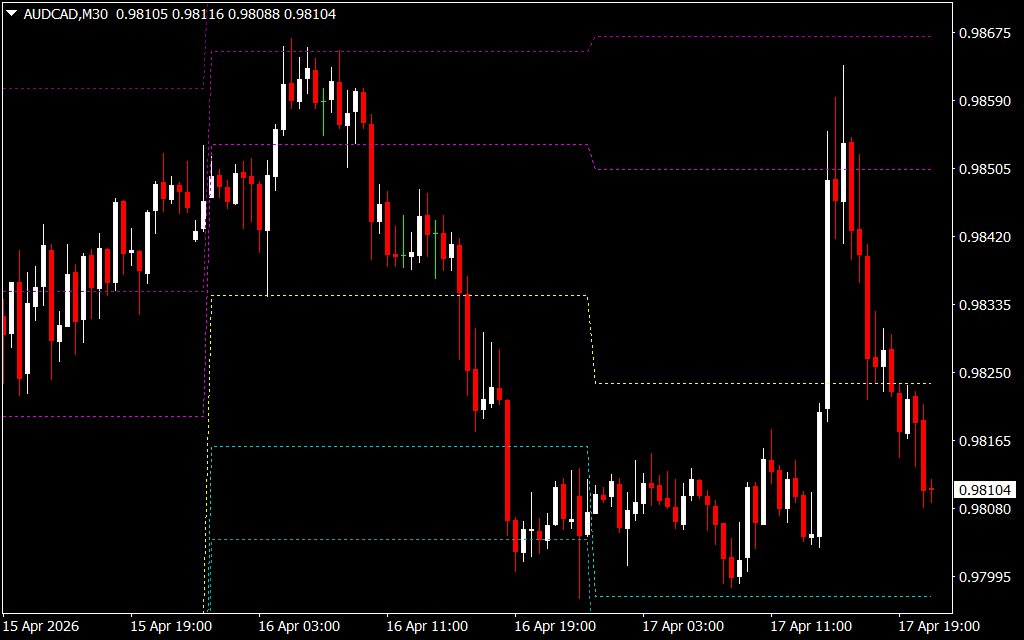
As observed in technical analysis on high-liquidity pairs like AUD/CAD on the M30 timeframe, the M Fibonacci system provides a definitive operational advantage:
- Dynamic Level Plotting: Unlike manual tools that remain static, the M Fibonacci Indicator updates in real-time based on the most recent swing highs and lows. As seen on recent M30 charts, this ensures that your retracement levels (23.6%, 38.2%, 50%, and 61.8%) are always calibrated to the current market volatility.
- Precision Entry Zones: The "Golden Ratio" (61.8%) is widely regarded as the most powerful reversal point in Forex. This indicator highlights these zones clearly, allowing traders to enter positions with tight stop-losses and favorable risk-to-reward ratios.
- Automated Extension Targets: Beyond retracements, the M Fibonacci tool plots expansion levels (such as 161.8% and 261.8%). These act as objective take-profit targets, helping traders exit positions at the exact moment a trend is likely to exhaust.
- Structural Confluence: By automating the drawing process, traders can easily spot "confluence zones"—where a Fibonacci level aligns perfectly with a horizontal support or resistance line. These "hotspots" represent the highest-conviction trade setups available in technical analysis.
Implementation for Professional Trading Systems
The M Fibonacci Indicator is an essential asset for any trader who values a disciplined, rule-based approach to the markets.
- Trend Confirmation: Use the indicator to measure the "health" of a trend. A trend that retraces only to the 38.2% level before continuing is considered exceptionally strong, whereas a deep retracement to 61.8% suggests a more balanced or fragile market.
- Surgical Stop Placement: Place your stop-losses just beyond the next major Fibonacci level. This provides your trade with enough "breathing room" while maintaining a logical exit if the Market Structure shifts.
- Multi-Timeframe Analysis: For maximum accuracy, look for overlapping Fibonacci levels across different timeframes. When an H4 retracement level aligns with an M30 expansion level, the resulting signal is significantly more reliable.
Conclusion
The M Fibonacci Indicator for MT4 is a definitive solution for traders who demand structural clarity and mathematical rigour. By bridging the gap between ancient mathematical principles and modern digital execution, it empowers you to navigate the financial markets with professional-grade confidence. Elevate your technical analysis today and master the art of institutional price levels with the M Fibonacci system.
SEO Meta Description
1 Download
Last Update:
Apr 18, 2026 00:08 AM
Published:
Feb 06, 2026 20:03 PM
Category: