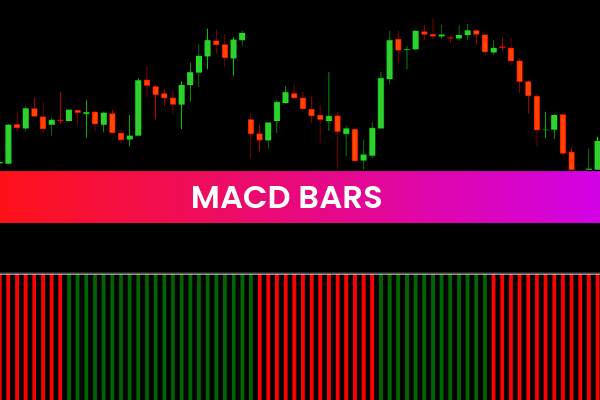
The MACD Bars Indicator transforms complex Moving Average Convergence Divergence (MACD) data into a clear, color-coded bar chart. Instead of relying on overlapping lines, this version highlights bullish and bearish momentum visually, helping traders quickly interpret market sentiment.
By converting MACD data into bars, this indicator enables both beginners and experienced traders to grasp trend direction and momentum shifts at a glance. It’s a powerful way to make informed trading decisions without the clutter of traditional technical charts.
How the MACD Bars Indicator Works
At its core, the MACD Bars Indicator represents the difference between the MACD line and its signal line.
Green bars indicate bullish momentum — the MACD line is above the signal line.
Red bars indicate bearish pressure — the MACD line is below the signal line.
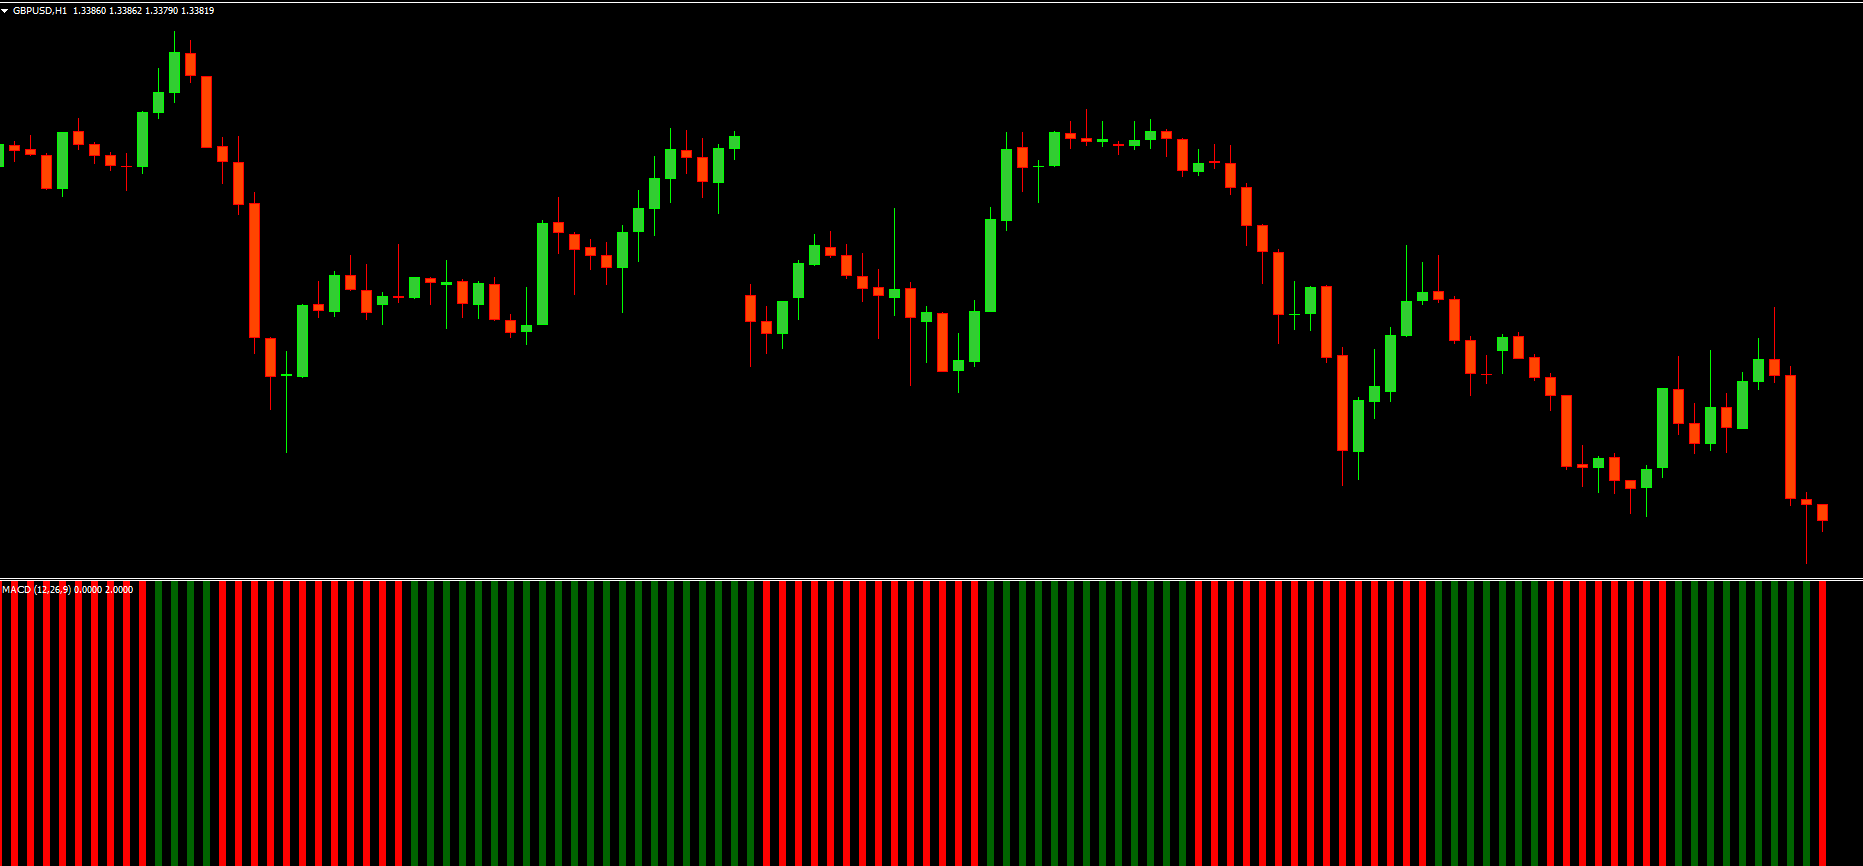
When bars change color, it signals a potential Trend Reversal or shift in momentum.
For instance, if the bars switch from red to green, it often marks the start of an upward trend. Conversely, a transition from green to red can warn of weakening bullish momentum or an upcoming downtrend. This visual simplicity allows traders to identify entry and exit points with confidence.
Example of a MACD Bars Signal
Imagine analyzing the EUR/USD pair on a 1-hour chart. After several red bars, a new green bar appears — this indicates rising bullish momentum. A trader might use this as confirmation to enter a buy trade, supported by other signals or indicators.
Similarly, when green bars fade and turn red, it could be a cue to exit the position or prepare for a short setup.
Benefits of Using the MACD Bars Indicator
Using the MACD Bars Indicator offers several key advantages:
Enhanced Clarity: Simplifies traditional MACD visualization.
Quick Decision-Making: Color-coded signals make analysis faster.
Reduced Chart Noise: Eliminates unnecessary lines and clutter.
Adaptable Across Markets: Works well on Forex, stocks, crypto, and indices.
Ideal for All Traders: Whether new or professional, anyone can interpret its signals easily.
By using visual cues instead of line crossovers, this indicator improves your ability to recognize momentum shifts and trend reversals before major market moves occur.
How to Integrate It into Your Trading Strategy
The MACD Bars Indicator can be combined with other tools to create a robust trading system:
Use with Moving Averages: Confirm the overall trend direction.
Combine with RSI or Stochastic: Validate overbought or oversold zones.
Apply on Multiple Timeframes: Align short-term signals with long-term trends for stronger confirmation.
For best results, always use risk management practices such as stop-loss orders and position sizing to protect capital.
Example Trading Strategy
A simple approach could be:
Wait for a color change on the MACD Bars Indicator.
Confirm with a moving average crossover.
Enter a position in the direction of the new bar color.
Set a stop-loss below/above the recent swing.
Exit when the bar color reverses or momentum weakens.
This straightforward system helps traders stay aligned with the trend while minimizing emotional decisions.
Why Traders Choose IndicatorForest.com
At IndicatorForest.com, we specialize in offering expertly developed MT4 and MT5 indicators, including the MACD Bars Indicator. Every tool is tested, optimized, and designed for performance across multiple market conditions.
Whether you’re learning the basics or refining your professional trading strategy, our collection of indicators provides the clarity you need to trade smarter, not harder.
Get Started Today
Ready to simplify your chart analysis?
👉 Download the MACD Bars Indicator today at IndicatorForest.com and start identifying trend shifts with precision.
5 Downloads
Published:
Dec 24, 2025 23:40 PM
Category: