Maximizing Trend Edge: The Macd Color Histogram Alert Ema Indicator
Identifying the precise turning point of a market trend is one of the most lucrative skills a technical analyst can develop. While moving averages excel at identifying long-term market direction, they struggle to capture the immediate shifts in volume and momentum that signal impending reversals. To bridge this structural gap, traders rely on oscillators. The Macd Color Histogram Alert Ema Indicator takes the classic Moving Average Convergence Divergence ($MACD$) framework and refines it into a highly visual, dual-colored momentum machine complete with automated crossover triggers.
Here is an in-depth breakdown of how this sub-window indicator operates and how you can deploy it to catch explosive trend reversals early.
The Architecture of the Macd Color Histogram
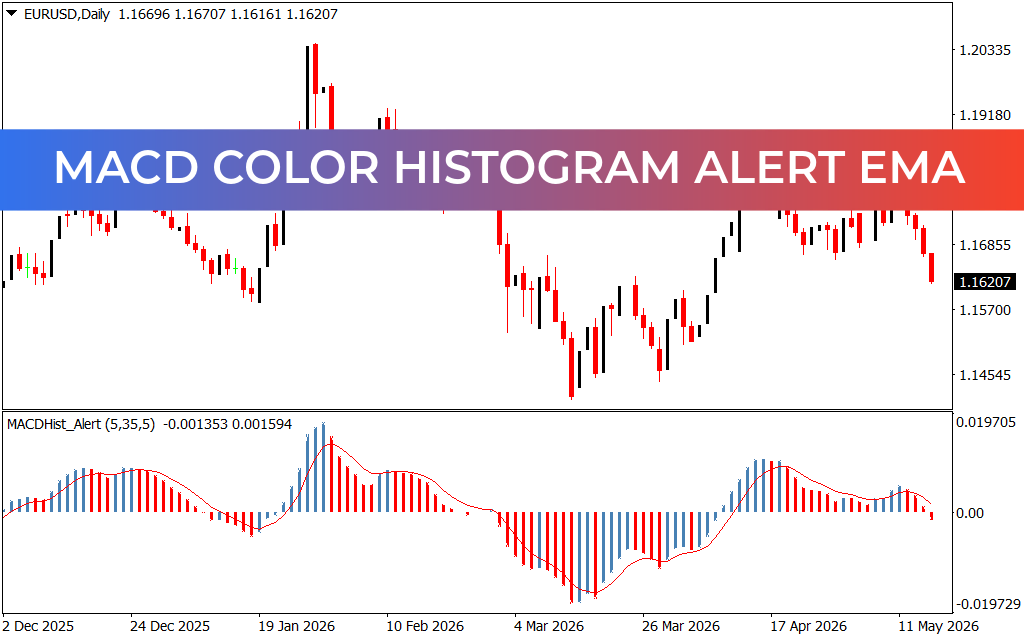
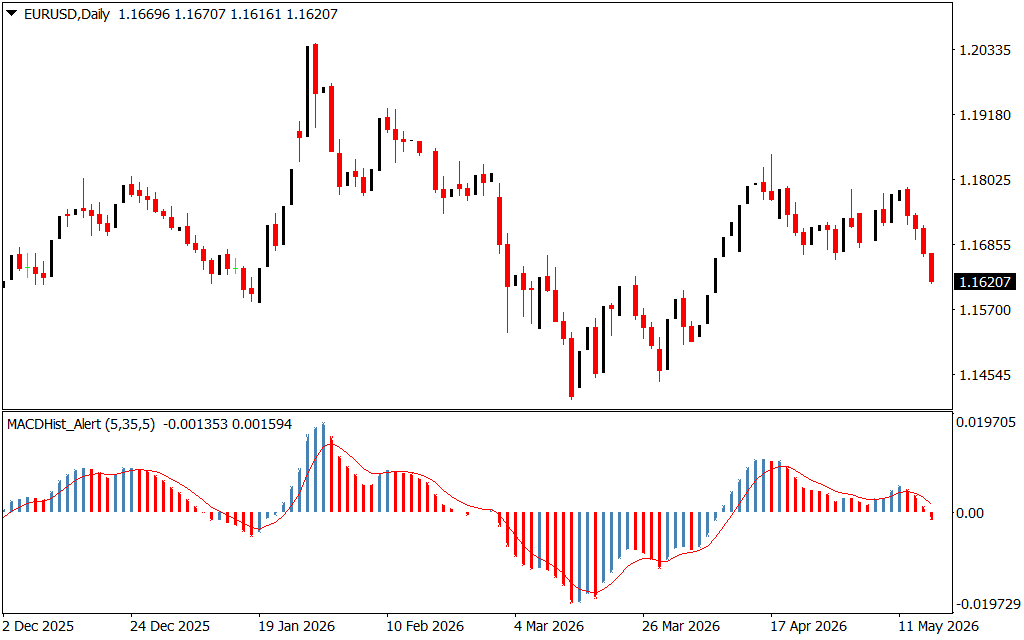
Operating in a clean sub-window directly below your primary candlestick chart, this indicator keeps your main terminal clear of visual clutter. The engine calculates momentum by analyzing three unique exponential moving average inputs, displayed on-screen as (5, 35, 5).
By processing a fast $EMA$, a slow $EMA$, and a smoothed signal line, the utility measures the absolute distance between these averages. Instead of presenting this data as tangled, lagging lines, it plots the information as an intuitive vertical histogram that visually grows or shrinks based on institutional order flow.
Decoding the Color Signals and Oscillator Levels
As showcased on the EUR/USD Daily chart, the indicator removes the guesswork from complex momentum calculations by breaking data down into distinct visual phases:
- The Zero-Line Equilibrium: The central $0.00$ axis serves as the ultimate boundary between bulls and bears. When the histogram prints above this line, buyers are driving the macroeconomic trend; when it shifts below, sellers hold the clear advantage.
- The Dual-Color Histogram Bars: * Light Blue Bars: Indicate expanding bullish momentum or contracting bearish pressure. This signals an ideal environment for long positions or short profit-taking.
- Red Bars: Alert you to expanding bearish momentum or fading bullish strength, warning you to avoid buying the asset.
- The Signal Line Crossover (White Line): This line tracks a smoothed average of the histogram itself. When the colored bars cross cleanly through the white signal line, it provides an immediate technical alert that a short-term trend shift is under way long before price breaks physical structural levels on the chart above.
Advanced Strategies for Active Terminals
To get the highest win-rate from the Macd Color Histogram Alert Ema indicator, implement these structural rules into your trading model:
- Spotting High-Probability Divergences: Watch for instances where the price chart makes a clear higher high, but the histogram prints a lower high. This bearish divergence reveals that the price rally is losing institutional backing and is prime for a sharp downside reversal.
- Multi-Timeframe Trend Filtering: Use the zero-line on the Daily chart to establish your structural market bias. If the histogram is below zero on the Daily chart, only take downside signal line crossovers on lower timeframes like the M15 or M5 to ensure you are trading with the path of least resistance.
- Objective Trade Management: The signal line crossovers offer perfect rule-based parameters for trade exits. If you are trailing a short trade and the red bars contract to cross back above the white signal line, it serves as an objective signal to lock in profits.
3 Downloads
Last Update:
May 17, 2026 01:48 AM
Published:
Jan 21, 2026 01:08 AM
Category: