Navigating Market Momentum: Trading Structural Waves with the MACD Mixie Indicator
In forex trading, momentum is the ultimate force that drives price from one structural level to the next. For day traders and high-frequency scalpers operating on lower timeframes, catching the exact moment when momentum shifts is the key to maintaining a highly profitable win rate. While standard oscillators often suffer from excessive noise or lagging signals, the MACD Mixie Indicator for MT4/MT5 combines classic moving average convergence divergence mathematics with advanced smoothing algorithms to deliver a pristine, crystal-clear view of intra-day market cycles.
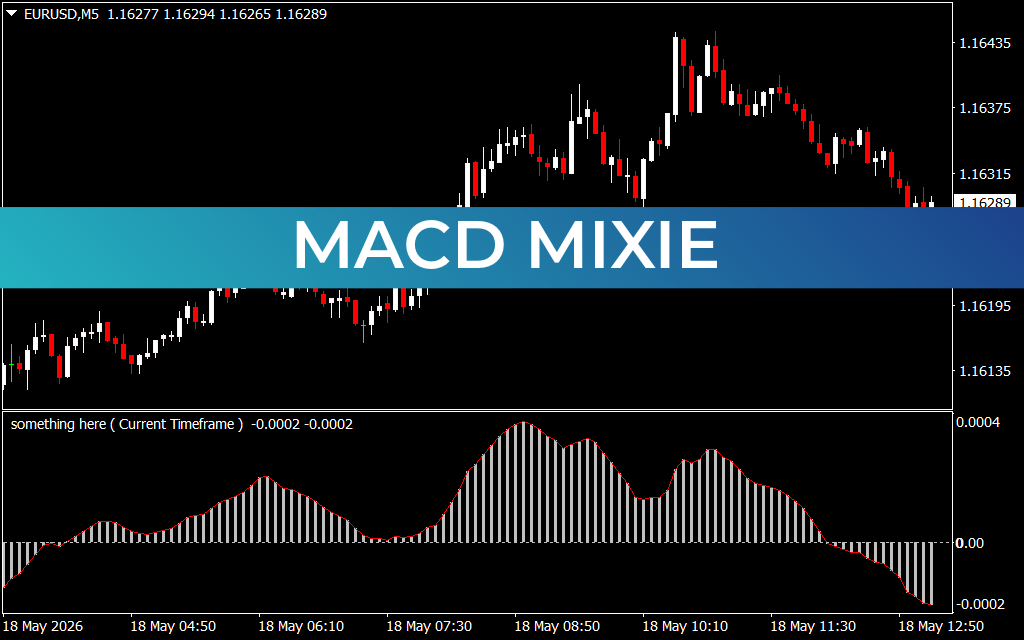
Decoding the Momentum Waves on EUR/USD M5
The provided EUR/USD 5-minute (M5) chart beautifully demonstrates how the MACD Mixie indicator translates volatile Price Action into smooth, tradeable momentum waves. Located in the sub-window, the indicator utilizes a combination of white histogram bars bounded by a dynamic red signal line, oscillating seamlessly around a critical 0.00 baseline.
Early in the May 18 session, the pair established an accumulation base near 1.16135. During this sideways consolidation, the MACD Mixie histogram bars hovered close to the zero line, signaling low market velocity. However, as buyers initiated a strong structural push past 1.16195, the indicator printed a powerful bullish expansion. The histogram bars crossed decisively above the 0.00 threshold, expanding upward in perfect symmetry with the price.
For a scalper, this clear crossover provides an immediate green light. It confirms that the upward move is backed by true institutional velocity rather than a deceptive retail stop-run. The price subsequently embarked on a massive multi-pip rally, cutting through historical resistance levels effortlessly.
Spotting Volatility Exhaustion and Hidden Divergences
One of the most extraordinary benefits of the MACD Mixie indicator is its ability to pinpoint exact structural turning points before they materialize on the main chart. Following the explosive morning rally, the EUR/USD pair printed a prominent double-top formation near the 1.16435 level between 08:50 and 10:10.
While the price action attempted to retest its previous highs, a glance at the MACD Mixie sub-window reveals a classic momentum divergence. The second peak on the histogram was significantly lower than the first, indicating that the buying power was rapidly depleting. As the red signal line rolled over and the white histogram bars began collapsing back toward the zero baseline, the indicator provided an early warning of a structural Trend Reversal.
Currently trading at 1.16289, the histogram has crossed beneath the 0.00 line into negative territory, confirming that the bears have successfully seized control of the immediate order flow. By utilizing the MACD Mixie indicator, day traders can avoid buying at overextended market tops, manage trailing stop-losses with extreme precision, and execute high-probability short positions exactly as institutional distribution begins.
1 Download
Last Update:
May 18, 2026 16:15 PM
Published:
Jan 20, 2026 14:42 PM
Category: