The MACD on Chart indicator for MT4 is an advanced tool designed to monitor market momentum directly on the main chart, unlike traditional MACD indicators that appear in a separate window. By combining fast and slow EMA crossovers with a 200-period MACD line, traders can easily anticipate precise buy and sell opportunities across various instruments, including forex and stocks.
What is the MACD on Chart Indicator?
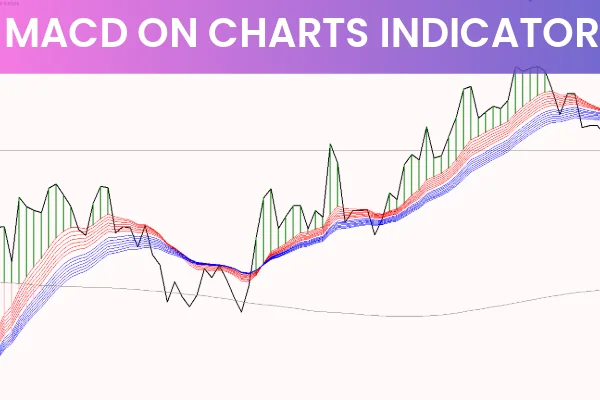
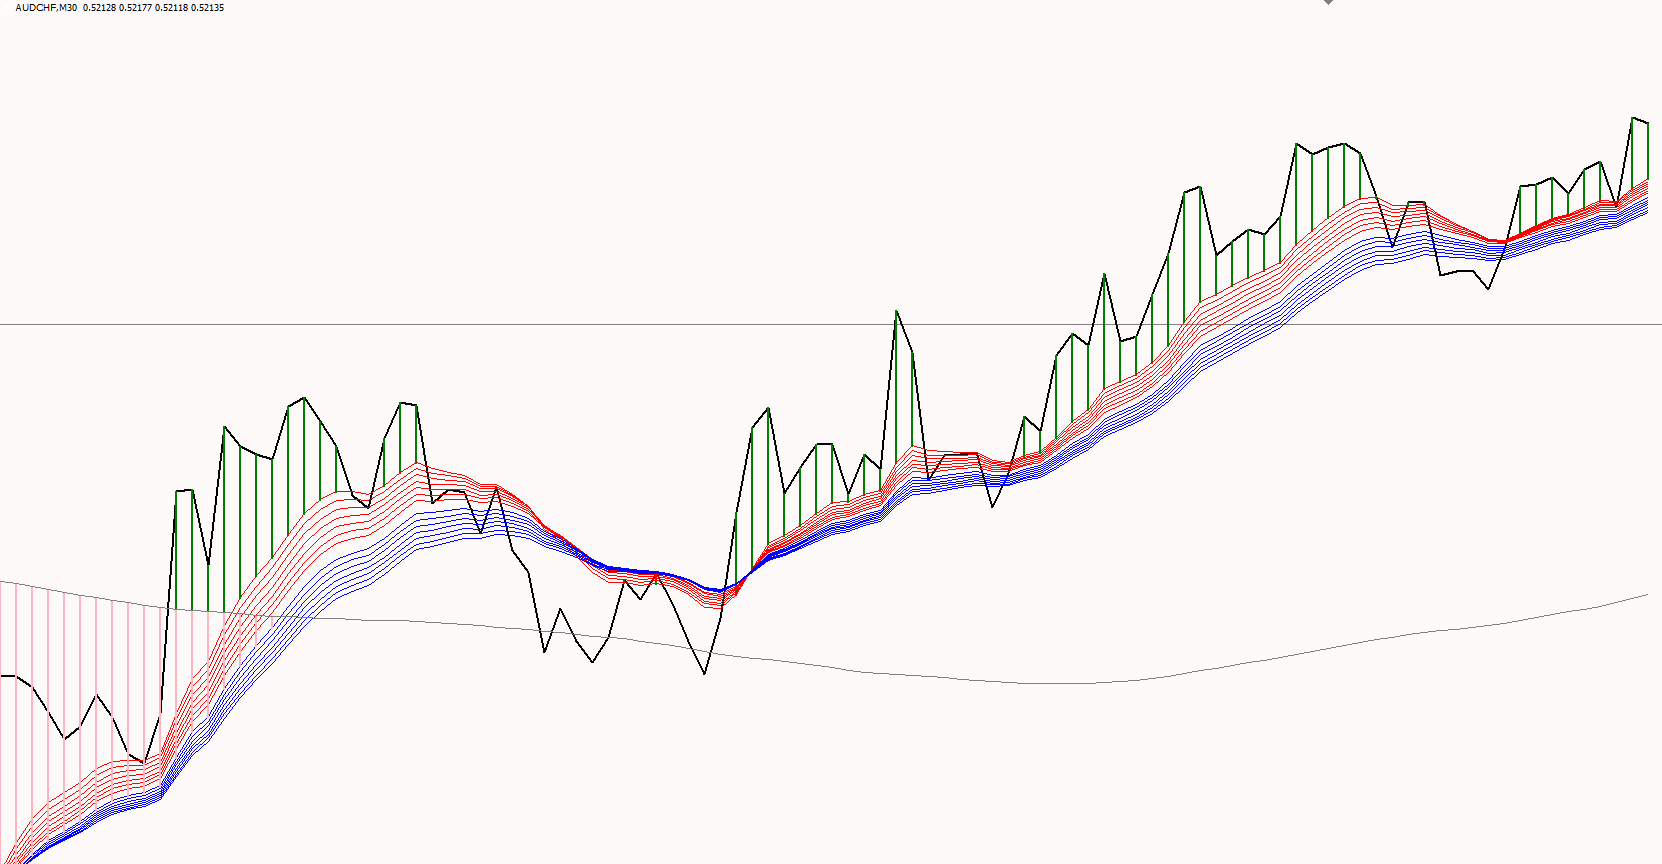
This indicator plots:
Seven fast and slow EMAs: Represented as red (fast) and blue (slow) curvilinear lines.
200-period MACD line: Gray line showing overall market momentum.
The combination of EMA crossovers with the MACD line enables traders to determine both trend direction and momentum status, improving trade entry accuracy.
How to Trade Using MACD on Chart
Bullish Setup
Confirm that price is above the MACD line, indicating bullish momentum.
Wait for the fast EMA (red) to cross above the slow EMA (blue).
Enter a long trade at the crossover point.
Exit when the price drops below the EMA levels or momentum weakens.
Bearish Setup
Confirm that price is below the MACD line, indicating bearish momentum.
Wait for the fast EMA (red) to cross below the slow EMA (blue).
Enter a short trade at the crossover point.
Exit when the price moves above the EMA levels or momentum reverses.
By following this method, traders can filter weak signals and focus on high-probability trade setups.
Advantages of MACD on Chart
Integrated Trend and Momentum Analysis: Combines EMA crossovers with MACD momentum in one chart.
Multi-Timeframe Support: Works effectively on different MT4 timeframes for intraday and swing trading.
Enhanced Trade Filtering: Reduces false signals and highlights stronger trade opportunities.
Suitable for All Traders: Beginner-friendly visualization and advanced utility for experienced traders.
Things to Keep in Mind
While the MACD on Chart indicator provides powerful trade signals, it is best used alongside other technical tools, such as RSI or support/resistance levels, to improve trade confirmation and risk management.
Conclusion
The MACD on Chart indicator for MT4 is a dynamic trend and momentum scanner that allows traders to identify high-probability buy and sell signals directly on the main chart. Its combination of EMA crossovers and MACD lines makes it a valuable tool for both novice and professional traders. Explore IndicatorForest.com to get the MACD on Chart indicator and elevate your MT4 trading strategy today.
FAQ
3 Downloads
Published:
Nov 23, 2025 03:00 AM
Category: