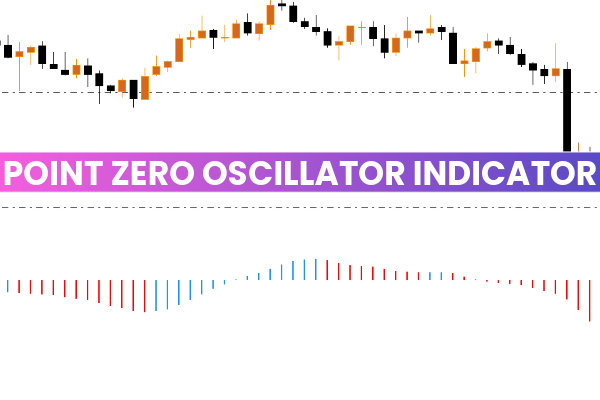
The Point Zero Oscillator Indicator for MT4 is a powerful, non-repainting Trend Indicator that helps traders determine market direction and trend strength with high accuracy. While it resembles the MACD indicator, it reacts faster to price movements, providing more precise and timely trading signals.

This oscillator plots color-coded histograms in a separate chart window, making it easy for traders to identify buy and sell opportunities at a glance. Whether you are a beginner or an experienced trader, the Point Zero Oscillator is a reliable tool for improving trade entries and exits in any market condition.
How the Point Zero Oscillator Works
The Point Zero Oscillator displays vertical histogram bars that oscillate around a central zero line, much like the traditional MACD.
Blue bars represent bullish momentum or an uptrend.
Red bars indicate bearish momentum or a downtrend.
The position and length of the bars relative to the zero line reveal the strength and direction of the current market trend. Longer bars show stronger momentum, while shorter bars indicate consolidation or a ranging market.
Unlike many indicators, the Point Zero Oscillator is non-repainting, meaning its signals remain fixed once printed, ensuring reliable analysis and backtesting.
How to Use the Point Zero Oscillator Indicator in MT4
Buy Signal
A buy signal appears when the indicator starts plotting blue bars above the zero line.
The appearance of blue bars suggests that buyers are gaining control.
Longer blue bars indicate a strong bullish trend.
💡 Example: When the blue bars cross above the zero line and continue to grow, it’s an ideal signal to consider long positions.
Sell Signal
A sell signal occurs when the indicator forms red bars below the zero line.
The market is under bearish control when red bars dominate.
Longer red bars confirm strong downward momentum.
💡 Example: When red bars start extending below the zero line, it’s a good time to look for sell opportunities.
Exit Strategy
The Point Zero Oscillator simplifies exit signals through color changes in the histogram bars:
When bars change from blue to red, it signals a possible end to the uptrend and start of a downtrend.
When bars change from red to blue, it indicates a potential bullish reversal.
This automatic color shift allows traders to spot trend reversals early without relying on additional indicators.
Real Market Example
Consider the GBP/NZD pair on an H4 timeframe:
During a ranging market, the bars remain short and close to the zero line, indicating weak momentum.
As the market transitions into a downtrend, long red bars form below the zero line, confirming strong selling pressure.
When the red bars shorten and blue bars begin forming above the zero line, a bullish reversal occurs — signaling a potential buy opportunity.
This visual clarity makes the Point Zero Oscillator an excellent companion for trend-following and momentum-based trading strategies.
Trading Tips
Combine the Point Zero Oscillator with Price Action or moving averages for trend confirmation.
Avoid trading during low-volatility periods when the bars are short and near the zero line.
Use the oscillator as a confirmation tool rather than a standalone system for higher accuracy.
Why Traders Prefer the Point Zero Oscillator
Non-repainting and reliable signals.
Faster reaction to price changes than MACD.
Works on all timeframes and instruments.
Simple color-coded display for easy interpretation.
Excellent for identifying momentum shifts and reversals.
Conclusion
The Point Zero Oscillator Indicator for MT4 is an advanced and user-friendly trading tool that helps traders identify trend direction, strength, and potential reversals quickly. Similar to MACD but more responsive, it provides clear buy and sell signals using blue and red histogram bars.
Whether you’re day trading, Scalping, or swing trading, this indicator enhances decision-making by offering accurate trend confirmation. Best of all, it’s free to download and compatible with all MT4 trading platforms.
FAQ
4 Downloads
Published:
Nov 09, 2025 10:43 AM
Category: