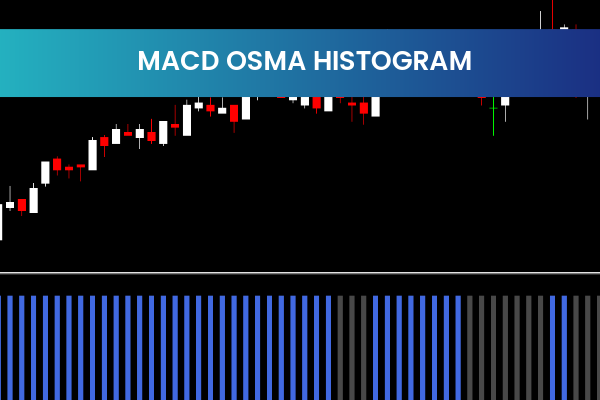
The MACD OSMA Histogram Indicator is a free and popular Forex Indicator designed for traders using the MetaTrader 4 (MT4) platform. By combining the Moving Average Convergence Divergence (MACD) with the Oscillator of Moving Averages (OSMA), this indicator provides traders with clear insights into market trends, momentum, and potential buy or sell opportunities. Its simplicity and versatility make it a valuable tool for both novice and experienced Forex traders.

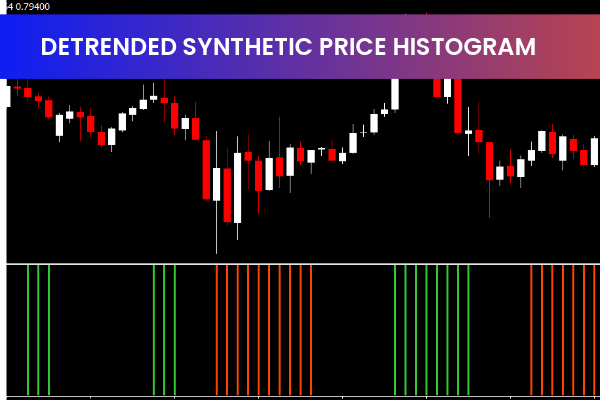
This indicator displays market data in a histogram format, allowing traders to easily interpret trend direction, strength, and potential reversals.
What Is the MACD OSMA Histogram Indicator
The MACD OSMA Histogram Indicator calculates the difference between the MACD line and its signal line, then plots it as a histogram. The OSMA component enhances trend detection by highlighting deviations and momentum changes. This combination provides a visual representation of market behavior, helping traders identify profitable trading opportunities.
How the MACD OSMA Histogram Indicator Works
Once applied to an MT4 chart, the indicator generates three primary types of signals:
Color Changes in the Histogram: Indicates a potential Trend Reversal, helping traders anticipate shifts in market direction.
Zero-Line Crossings: When histogram bars cross above the zero-line, it signals bullish conditions; crossing below the zero-line signals bearish conditions.
Histogram Width Changes: Bars that become narrower or wider highlight market volatility, indicating strengthening or weakening momentum.
By combining these signals, traders can make informed decisions on when to enter or exit trades.
Trend Reversals
Color changes in the histogram provide an early visual cue for trend reversals. For instance, a shift from red to green suggests a potential bullish reversal, while a shift from green to red signals a bearish reversal.
Bullish and Bearish Signals
The zero-line crossing is one of the most reliable signals. Bars moving above the zero-line indicate a favorable buying environment, whereas bars moving below the zero-line highlight potential selling opportunities.
Market Volatility
The width of the histogram bars reflects market momentum. Expanding bars indicate strengthening trends, while contracting bars suggest weakening trends or market consolidation. This helps traders anticipate volatility and adjust their strategies accordingly.
Using the MACD OSMA Histogram Indicator Effectively
For optimal performance, the MACD OSMA Histogram Indicator should be combined with other technical analysis tools such as Support And Resistance levels, trend lines, or oscillators. Confirming signals across multiple indicators reduces the likelihood of false entries and increases trade accuracy.
Traders should also practice proper risk management, including using stop-loss orders and appropriate position sizing, to protect trading capital.
Why Traders Prefer the MACD OSMA Histogram Indicator
This indicator is popular because it simplifies complex market data into an easy-to-read histogram, enabling quick decisions. Its combination of trend, momentum, and volatility analysis makes it a versatile tool suitable for all levels of traders.
By providing timely and clear signals, the MACD OSMA Histogram Indicator helps traders maximize opportunities while minimizing risk.
Enhance Your Trading with IndicatorForest
The MACD OSMA Histogram Indicator is a must-have tool for Forex traders seeking accurate trend and momentum insights. To explore more free MT4 indicators that improve trading strategies, visit IndicatorForest.com and discover a wide selection of professional Forex tools.
2 Downloads
Published:
Jan 15, 2026 14:41 PM
Category: