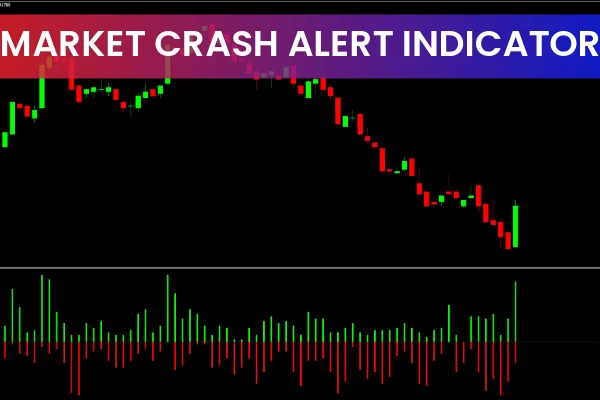
The Market Crash Alert Indicator for MT4 is a powerful volatility-based tool designed to detect sudden and aggressive price movements in the forex market. By monitoring candle sizes and measuring instant volatility changes, the indicator alerts traders when the market makes a strong upward or downward push. These alerts often occur at the beginning of high-quality trends, making the tool extremely valuable for breakout traders, momentum traders, and volatility-focused intraday traders.
For many traders, monitoring charts all day is exhausting and impractical. This indicator solves that problem by sending automatic alerts whenever price volatility exceeds a critical threshold. This means traders no longer need to stare at their screens continuously—signals come directly from the indicator as the market moves.
Because the Market Crash Alert Indicator works purely from volatility data rather than lagging trend metrics, it responds quickly to major market events, news releases, and aggressive institutional pushes. Its fast reaction time makes it ideal for traders who want to catch early trend moments before the larger crowd jumps in.
How the Market Crash Alert Indicator Works
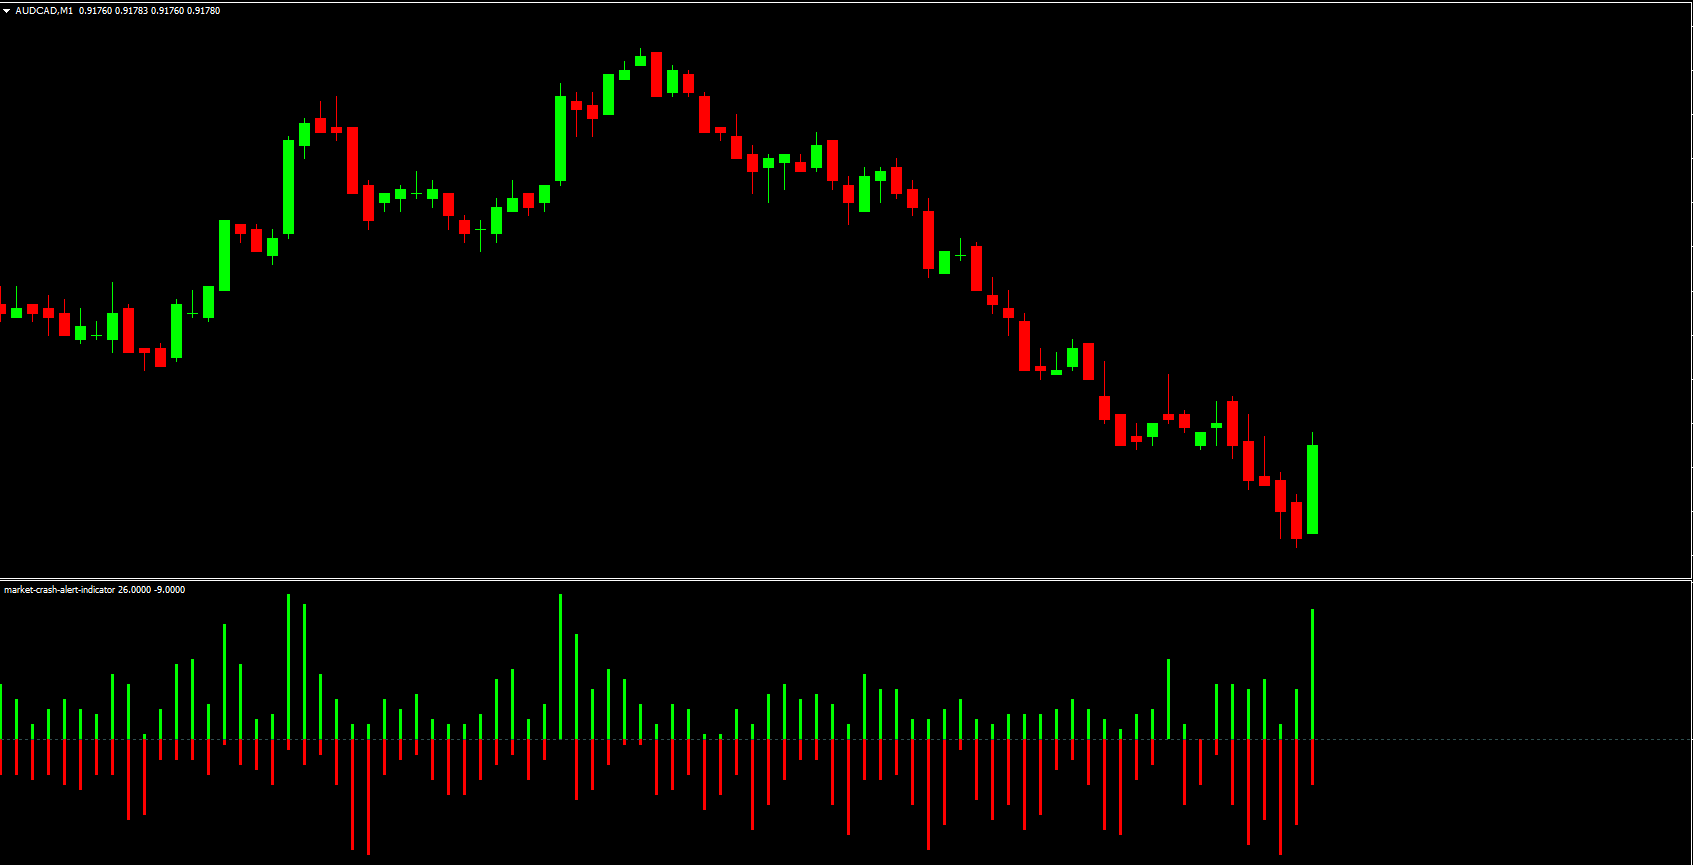
The system plots red and green histogram bars in a separate indicator window.
Green bars represent bullish volatility
Red bars represent bearish volatility
These bars move above or below benchmark volatility levels. The most important levels are:
+200 and above → strong bullish volatility surge
–200 and below → strong bearish volatility surge
A move above +200 typically indicates that buyers have taken aggressive control of the market. Conversely, a drop below –200 warns that sellers have entered with significant force.
These extreme volatility readings are the earliest sign of new market momentum. Unlike moving averages or trend indicators, the Market Crash Alert reacts immediately when candle sizes expand rapidly.
Market Crash Alert Indicator Trading Signals
Buy Signal
Enter a buy trade when:
Green volatility bars rise above +200
Price Action confirms the direction (optional)
Stop loss is placed below the most recent swing low
Buy signals above +200 often mark the beginning of strong bullish sequences—especially after consolidation or news-driven momentum.
Sell Signal
Enter a sell position when:
Red bars drop below –200
Price begins forming lower lows or bearish candles
Place the stop loss above the previous swing high
Volatility dips below –200 indicate intense bearish pressure, making this a reliable trigger for short entries.
Setting Targets
Profit targets can be placed based on:
Predefined risk-reward ratios
Recent support/resistance zones
ATR-based trailing stop
Structural highs/lows
Because volatility spikes often lead to sustained movement, traders commonly aim for 1:2 or 1:3 risk-reward setups.
Why Traders Love This Indicator
The Market Crash Alert Indicator is popular because:
It detects volatility instantly
It provides early trend entries
It removes the need for constant chart monitoring
It works on all MT4 timeframes
It supports all forex pairs, indices, metals, and crypto
It offers clear, objective buy and sell signals
It is ideal for breakout and momentum trading
Traders who like fast-moving markets—especially during London and New York sessions—find this tool extremely effective.
Conclusion
The Market Crash Alert Indicator for MT4 is an excellent tool for spotting sudden market spikes that often signal the start of major trends. By focusing on pure volatility, it helps traders catch explosive moves early, offering valuable buy and sell opportunities. However, for best results, it should be used together with price-action tools or trend indicators for confirmation.
For more professional MT4/MT5 indicators, visit IndicatorForest.com.
FAQ
14 Downloads
Published:
Dec 07, 2025 09:54 AM
Category: