Mastering Session Value with Market Profile for MT5
In the world of professional trading, understanding where the market has spent the most time and volume is far more critical than simply looking at Price Action. The Market Profile for MetaTrader 5 is a strategic charting technique that provides a multi-dimensional view of market activity. By shifting the focus from horizontal time to vertical price distribution, this indicator identifies the "Fair Value" of an asset, helping traders spot high-probability entry and exit zones based on institutional Supply And Demand.
Understanding Market Profile Structures
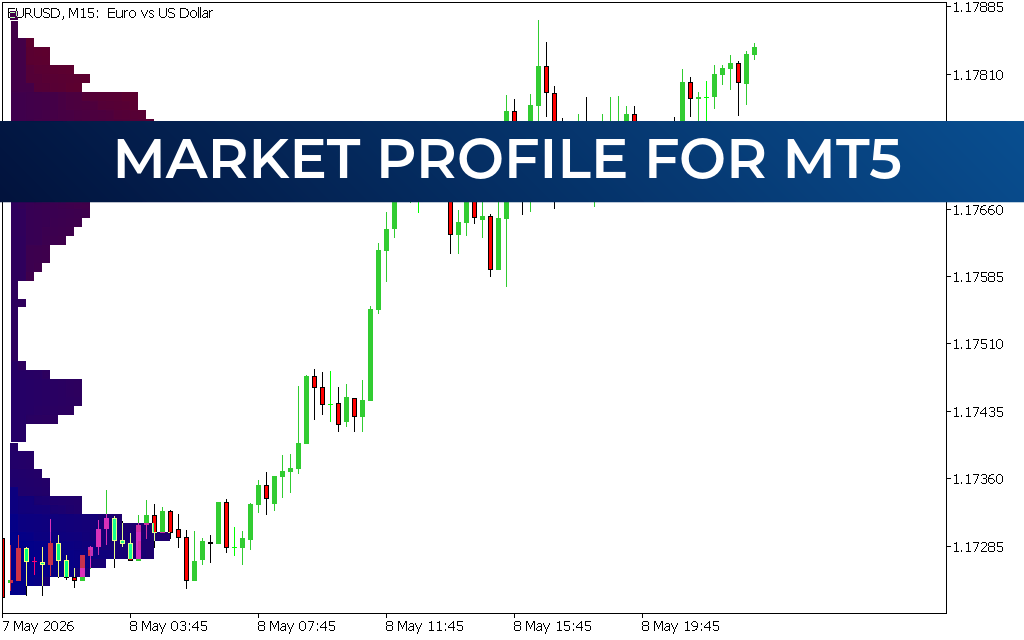
Market Profile (also known as TPO - Time Price Opportunity) organizes a day’s trading into a distribution curve. Key elements visible on the MT5 interface include:
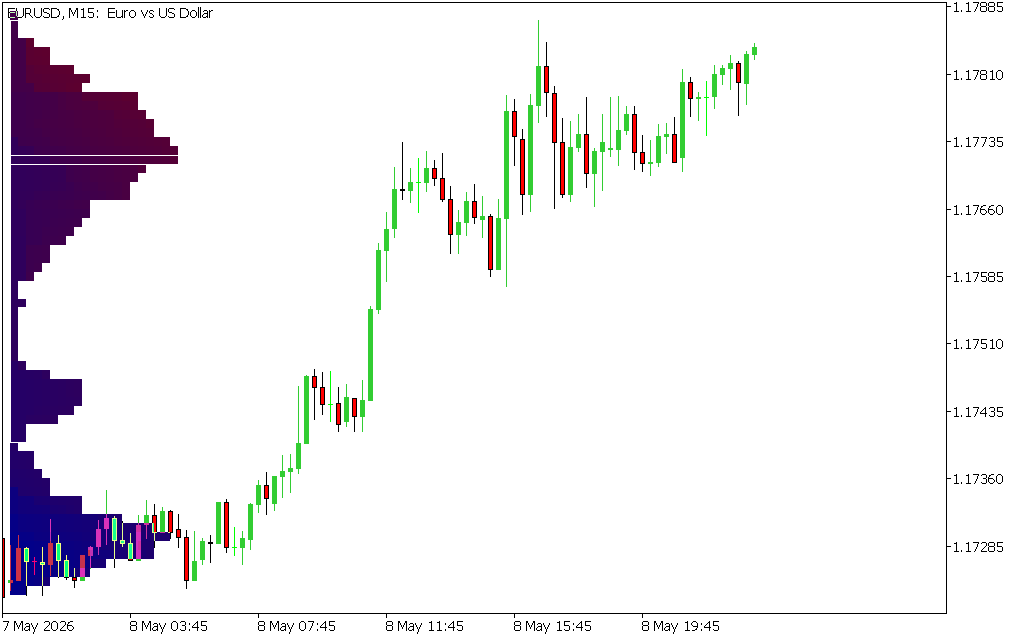
- Point of Control (POC): The price level where the most trading activity occurred. It represents the "fairest" price for the session and acts as a powerful magnet for future price action.
- Value Area (VA): The range where 70% of the day’s trading took place. If the price is trading above the Value Area, the market is perceived as "expensive"; below it, the market is "cheap."
- High/Low Volume Nodes: High Volume Nodes (HVN) indicate areas of heavy consolidation and support, while Low Volume Nodes (LVN) represent areas where the price moved quickly, often leading to rapid breakouts in future sessions.
Key Benefits for Technical Analysis
- Identifying Institutional Interest: Market Profile strips away the noise of individual candlesticks to show where "Smart Money" is accumulating or distributing positions.
- Predicting Breakouts and Reversals: When the price moves out of a balanced Value Area, it often indicates the start of a new trend. Conversely, if price tests the edge of the Value Area and fails to break out, a mean-reversion trade back to the POC is likely.
- Visualizing Market Sentiment: The shape of the profile—whether it is a "P" shape (short-covering), a "b" shape (long-liquidation), or a balanced "D" shape—gives traders immediate insight into the current market sentiment.
- Support And Resistance Accuracy: Unlike standard horizontal lines, Market Profile levels are dynamic. A previous session’s POC often acts as a significant support or resistance level in the current session.
Strategic Trading Application
Professional traders use the Market Profile for MT5 to develop a "market map." If the market opens above the previous day's Value Area and stays there, the bias is strictly bullish. If the market is stuck within the previous day's range, traders focus on buying at the Value Area Low (VAL) and selling at the Value Area High (VAH).
Conclusion
The Market Profile indicator for MT5 is an essential tool for anyone looking to trade with institutional precision. By understanding the distribution of value, you can stop chasing price and start trading at the levels that actually matter to the big players.
12 Downloads
Last Update:
May 09, 2026 01:20 AM
Published:
Jan 25, 2026 14:18 PM
Category: