Avoid Bad Trades: How to Filter Market Conditions with a Market Strength Indicator
The biggest trap for day traders isn't getting the direction wrong—it is trading when the market isn't moving at all. When liquidity dries up and Price Action begins to range sideways, traditional trend-following strategies trigger false signal after false signal. To avoid this costly "whipsaw" effect, successful traders rely on volume and volatility filters. Utilizing a dedicated Market Strength Indicator is one of the most efficient ways to instantly determine whether the market is worth trading or if it is time to sit on the sidelines.
What is a Market Strength Indicator?
A Market Strength indicator evaluates underlying market dynamics—combining volume, average true range (ATR), or momentum—to quantify the intensity of a move. Instead of showing where the price is going, it answers a more critical foundational question: Is the current move backed by real institutional volume, or is it just market noise?
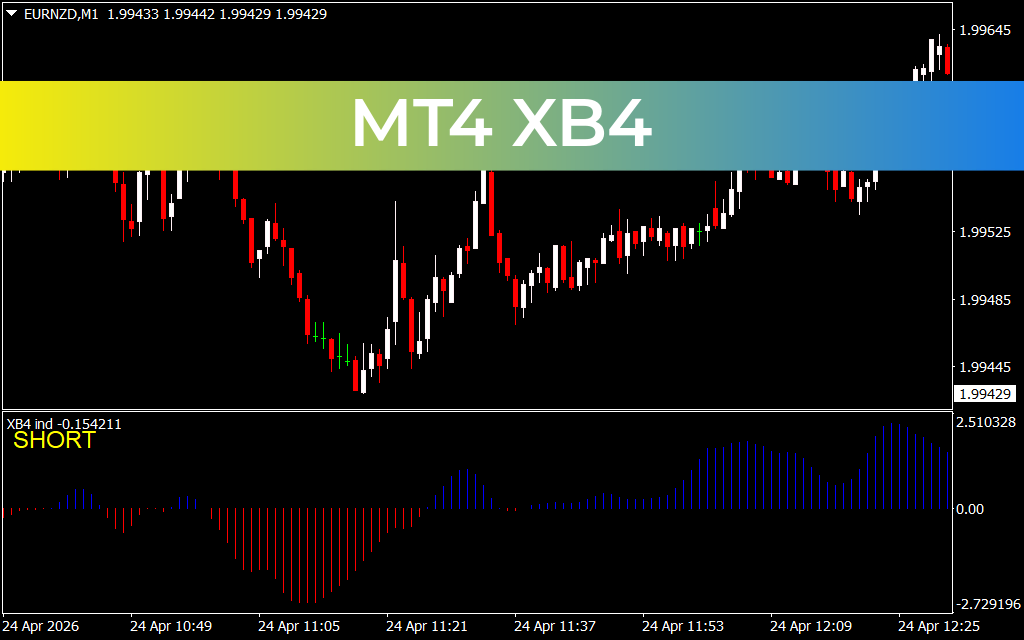
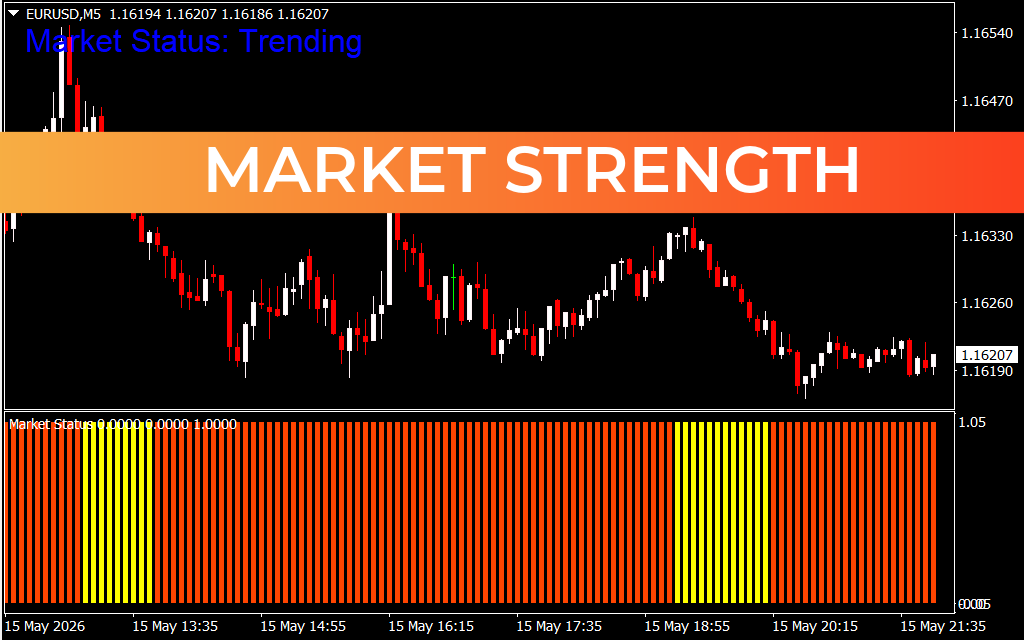
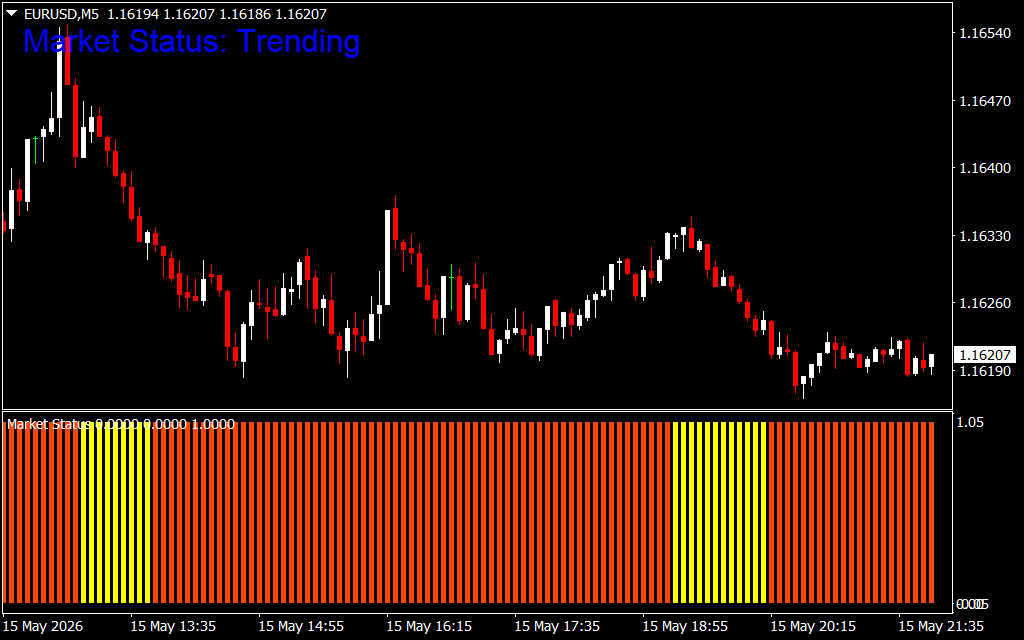
As a bottom-window histogram tool, it uses contrasting colors to segment market states:
- Bright Orange/Red Bars: Indicate a high-volatility, high-volume environment. This signals that the market is actively Trending and momentum-based strategies are highly favored.
- Yellow Bars: Signal low volatility and weak participation. This indicates a choppy, sideways Ranging market where trend breakout strategies are likely to fail.
The Power of the Market Status Tool
In fast-paced environments like the 5-minute (M5) chart on EUR/USD, market conditions shift rapidly. A visual filter like the Market Status Indicator simplifies this transition.
During an extended corrective wave or an unpredictable consolidation phase, a glance at the main candlestick chart might tempt a trader to force an entry. However, when the histogram under the chart consistently prints solid orange bars, it confirms a sustained influx of market strength. It validates that the micro-trend has institutional backing, giving breakout and trend-continuation traders the confidence to execute their positions. Conversely, when the indicator flips to yellow, it serves as an immediate warning to tighten stop-losses or pause new entries.
Integrating Market Strength Into Your Strategy
To build a robust trading system, use the Market Strength indicator as your primary operational green light:
- The Volatility Filter: Before entering any trend trade, check the histogram. If a moving average crossover or support break occurs while the bars are yellow (weak strength), skip the trade. Only execute when the indicator displays high-strength orange bars.
- SMC & Volume Spread Alignment: For traders utilizing Smart Money Concepts (SMC) or Volume Spread Analysis (VSA), this indicator acts as a reliable confirmation tool. High-strength bars validate that an apparent mitigation or order block tap is occurring with genuine market interest.
- Adapting to the Environment: When the indicator warns of low strength (yellow), shift your style to range-bound strategies—buying near verified support and selling near resistance—or wait for the New York or London session opens to bring volume back.
2 Downloads
Last Update:
May 16, 2026 14:55 PM
Published:
Jan 21, 2026 01:37 AM
Category: