Mastering Intraday Precision with the Midday Indicators
For traders operating in the highly liquid Forex markets, the middle of the trading session often presents a unique set of challenges. As initial morning momentum fades, the market frequently enters a phase of price discovery or retracement. The Midday Indicators for MetaTrader 4 (MT4) are engineered to navigate these specific windows, providing traders with clear, actionable signals to capture high-probability reversals and trend continuations.
What are the Midday Indicators?
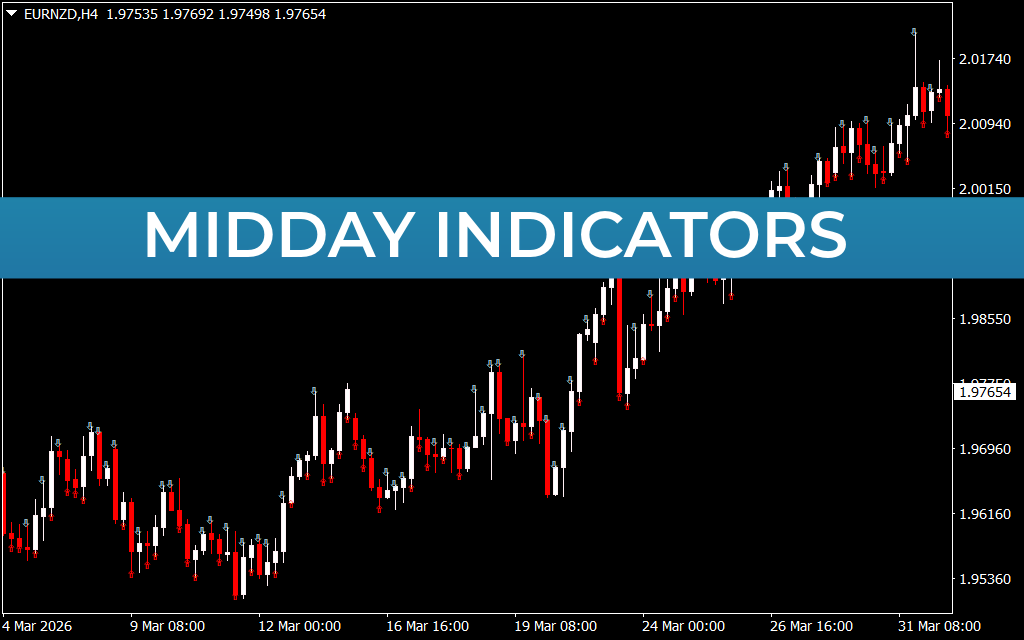
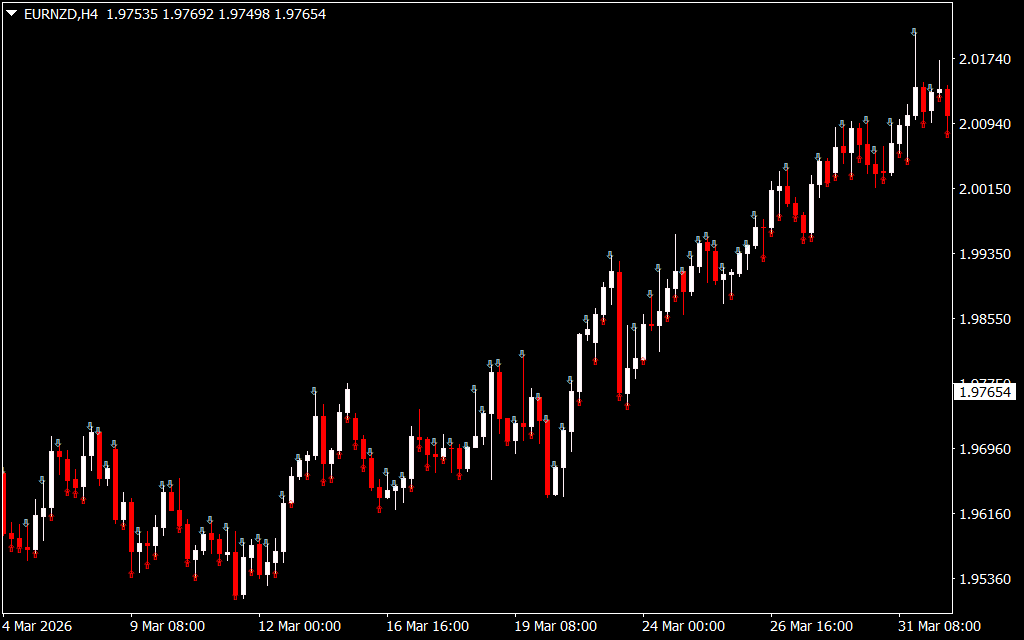
The Midday Indicators system is a price-action-based signaling tool that focuses on identifying market "stalls." By analyzing candle formations and local support/resistance interactions, the indicator plots small arrows on the chart:
- Blue Downward Arrows: Appear at localized peaks, signaling that buying pressure is exhausting and a downward correction or reversal is likely.
- Red Upward Arrows: Appear at localized troughs, suggesting that sellers are losing control and a bullish bounce is imminent.
As seen on the H4 chart, these signals often appear in clusters during strong trends, helping traders identify "buy the dip" or "sell the rally" opportunities with mathematical consistency.
Key Benefits for MT4 Traders
- Non-Lagging Signals: Unlike moving average-based oscillators that wait for price to turn, Midday Indicators focus on real-time Price Action, often catching the very wick of a reversal candle.
- Volatility Filtration: The indicator is designed to stay quiet during low-volume periods, only generating signals when there is a significant statistical probability of a move.
- Trend Confluence: As illustrated in the EURNZD example, during a strong bullish trend, the red upward arrows act as perfect confirmation signals for entering long positions after a minor pullback.
- Visual Simplicity: The clean interface allows you to keep your charts uncluttered. There are no messy lines or sub-windows; only clear directional triggers.
Strategic Application
To maximize the effectiveness of the Midday Indicators, professional traders often use them in conjunction with higher-timeframe structure. For instance, if price is testing a major daily resistance level and a blue Midday arrow appears on the H4 or H1 chart, the probability of a successful short trade increases dramatically.
For risk management, these arrows provide definitive "anchor points." A common strategy is to place a stop-loss just a few pips above the candle that triggered a blue arrow or below the candle that triggered a red arrow. This allows for a very tight risk-to-reward ratio, which is essential for long-term profitability. Whether you are a dedicated day trader or a swing trader looking for optimal entries, the Midday Indicators provide the visual edge required to execute trades with confidence.
1 Download
Last Update:
May 08, 2026 20:18 PM
Published:
Jan 25, 2026 21:18 PM
Category: