The Momentum Reversal Detector Indicator for MT5 is a powerful tool for momentum traders, divergence traders, and Forex trend traders. Designed to identify key momentum reversal points and trend-changing moments, this indicator provides actionable signals that allow traders to enter trades early and stay aligned with the market direction. Available for free at IndicatorForest.com, the Momentum Reversal Detector makes trading simpler and more precise
.
Key Features of the Momentum Reversal Detector Indicator
The Momentum Reversal Detector Indicator stands out due to its combination of momentum detection, divergence identification, and multi-timeframe analysis.
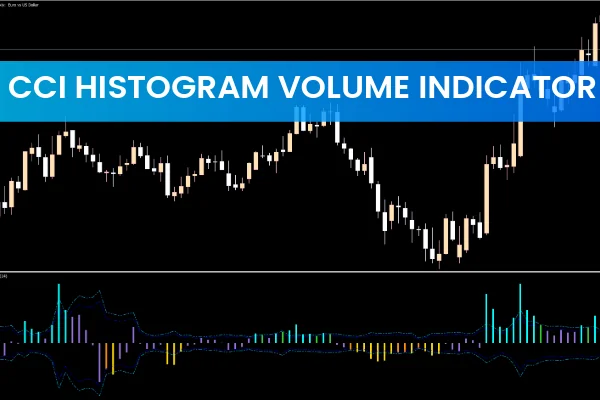
Multi-Timeframe Momentum Analysis
The indicator checks momentum levels on higher timeframes and displays them on a histogram, allowing traders to:
Align trades with higher timeframe momentum
Identify better entry points on lower timeframes
Avoid trading against the prevailing market trend
Divergence Detection
Divergence is a key signal for potential trend reversals. The indicator:
Detects divergence on the current and higher timeframes
Displays divergence signals on the histogram for easy interpretation
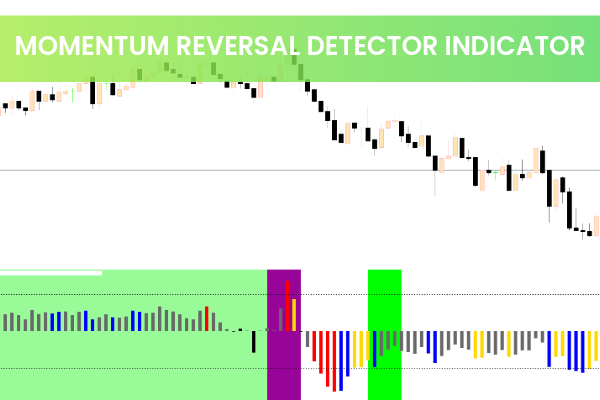
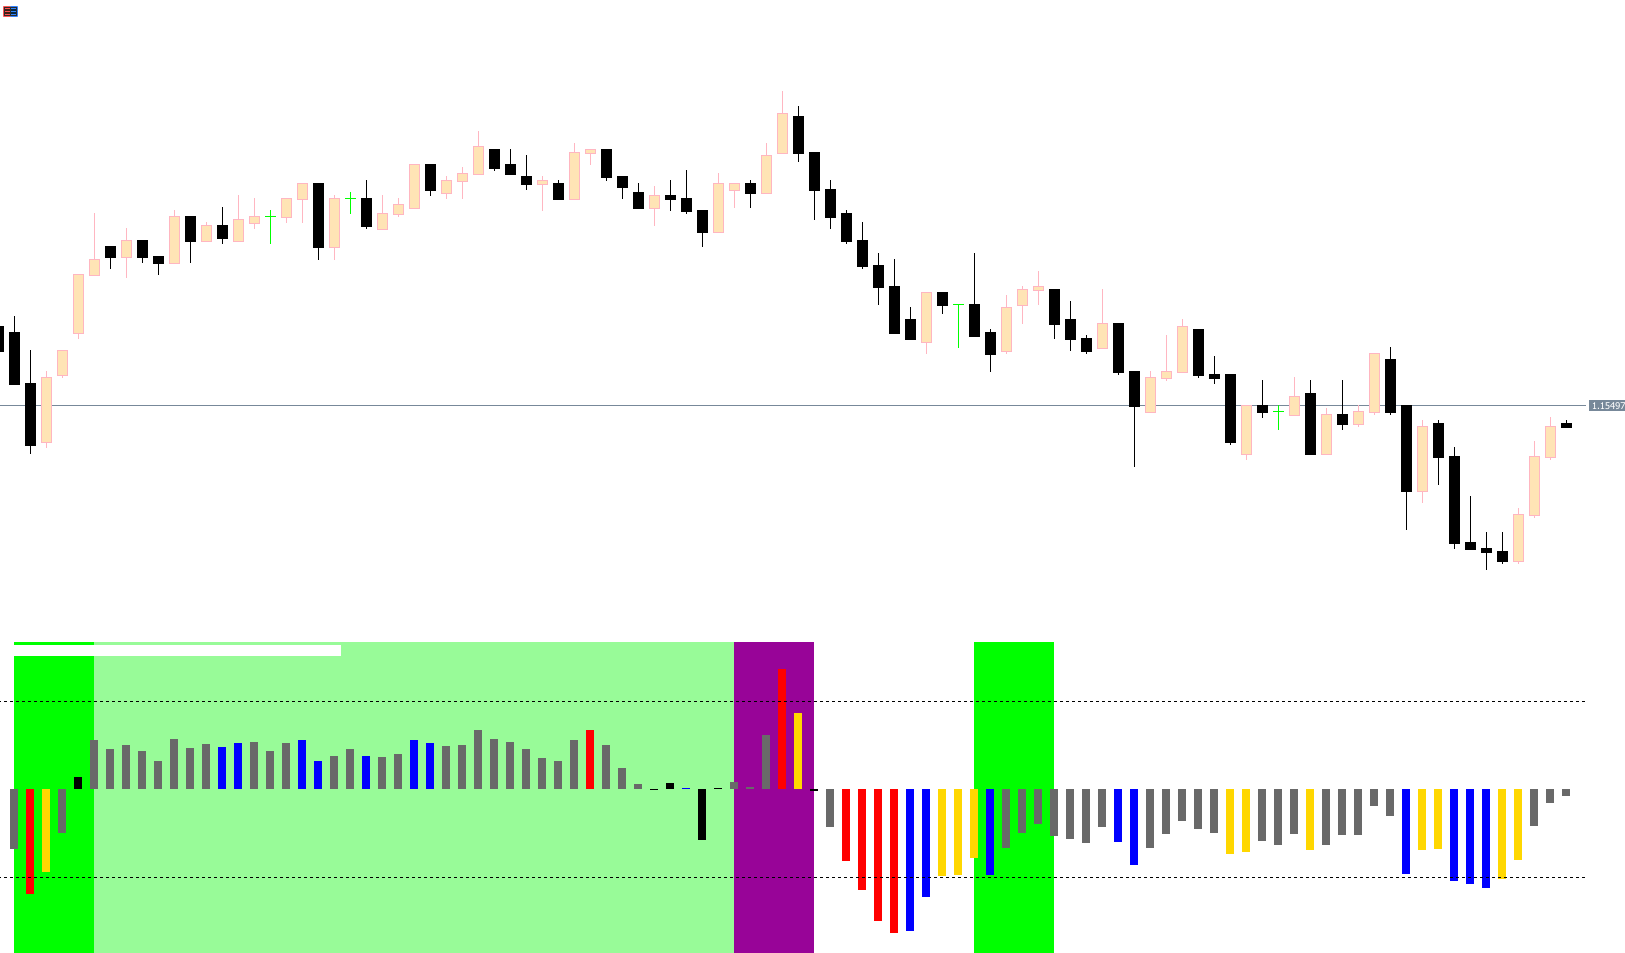
Uses background colors to indicate divergence type:
Purple: UP divergence
Lime: DOWN divergence
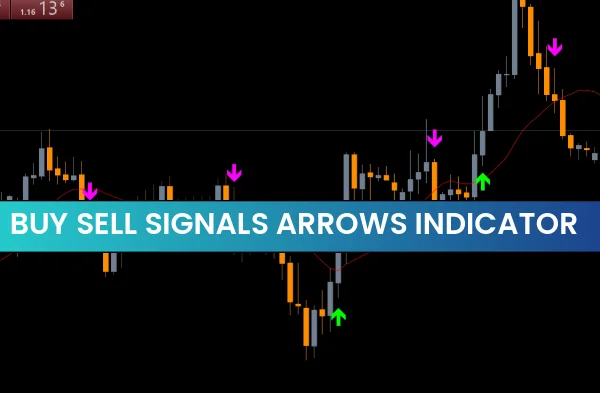
Signal Presentation
The Momentum Reversal Detector displays signals in a clear, visual format:
Black histogram bar: Indicates a momentum or Trend Reversal (BUY or SELL)
Pale green background: Confirms positive momentum on a higher timeframe
Dots show the indicator levels and zero level for reference
This clear visual approach allows both new and experienced traders to interpret the market quickly and accurately.
How to Trade with the Momentum Reversal Detector Indicator
Attach the indicator to your MT5 chart.
Watch for black bars on the histogram to signal momentum reversals.
Black bar up: Consider a BUY trade.
Black bar down: Consider a SELL trade.
Confirm signals with higher timeframe momentum:
Pale green background: Confirms bullish trend alignment.
Purple or lime background: Indicates divergence for further analysis.
Combine with your trading strategy for intraday or swing trades.
The indicator works well in combination with other trend or momentum tools, making it versatile for multiple trading styles.
Benefits of Using the Momentum Reversal Detector Indicator
Early Entry Points: Identify tops, bottoms, and trend reversals before the market moves
Multi-Timeframe Insight: Align trades with higher timeframe momentum for higher probability setups
Divergence Detection: Spot potential reversal points using divergence signals
Free and Easy to Install: Available for MT5 with simple setup
Ideal for All Traders: Supports new traders and experienced professionals, as well as intraday and swing trading
Conclusion
The Momentum Reversal Detector Indicator for MT5 is a must-have tool for Forex traders seeking accurate momentum and trend reversal signals. By combining multi-timeframe momentum analysis, divergence detection, and clear visual alerts, the indicator empowers traders to make informed decisions and enter trades early. Free to download from IndicatorForest.com, this MT5 indicator is suitable for intraday and swing trading, as well as both novice and experienced traders.
Start using the Momentum Reversal Detector Indicator today to improve your trading precision and confidence.
FAQ
10 Downloads
Published:
Nov 11, 2025 13:46 PM
Category: