Mastering Key Support and Resistance with the Mt4 Fractal Symmetric Indicator
In technical analysis, map-reading structural Support And Resistance levels is the fundamental step to establishing a consistent trading edge. Retail traders often struggle to identify these crucial levels, cluttering their charts with dozens of subjective lines that lead to analysis paralysis. Traditional static pivot points or moving averages fail to adjust dynamically as market structures shift, frequently causing traders to enter breakouts late or misinterpret reversals. The Mt4 Fractal Symmetric indicator addresses this issue by utilizing mathematical symmetry and Bill Williams’ classic fractal theory to deliver pristine, objective key zones.
The Algorithmic Magic of Fractal Symmetry
To deliver real-time, institutional-grade market levels, the Mt4 Fractal Symmetric indicator relies on a highly sophisticated mathematical scanning engine. It operates on the core principle that financial markets are fractal in nature—meaning complex price behaviors repeat across all timeframes.
The indicator maps structural high and low pivot points by scanning for geometric, five-candle symmetric arrays. A bullish fractal structure forms when a candle high is flanked by two lower highs on the left and two lower highs on the right. Conversely, a bearish fractal requires a central low flanked by two higher lows on both sides. By using a multi-timeframe engine (fractal-symmetric-mtf-indicator), this tool filters out short-term market static and plots only the most statistically significant price horizons.
Streamlining Market Structure with Dot-Matrix Horizons
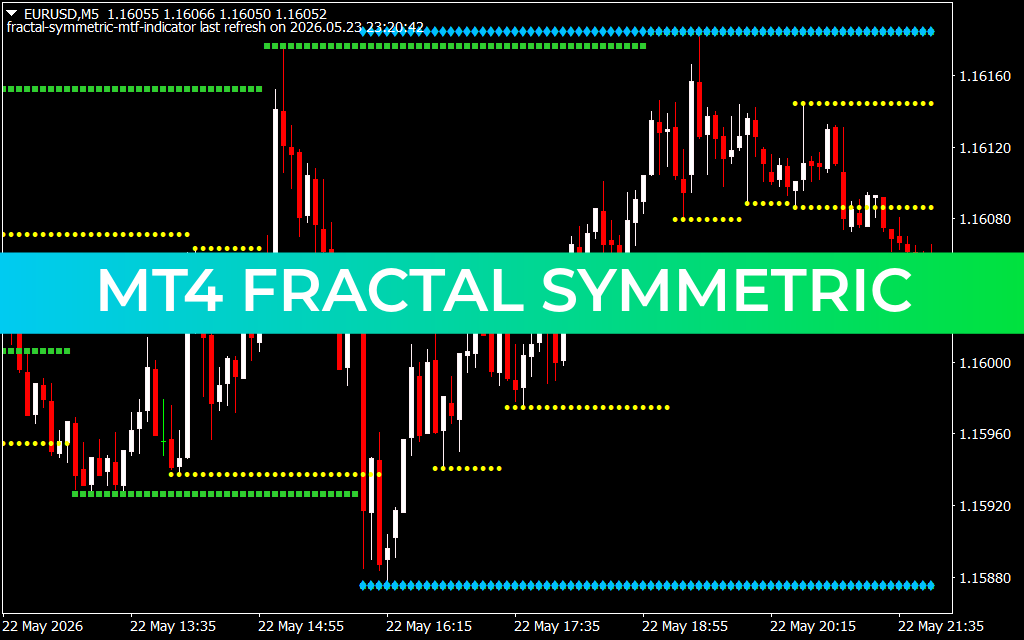
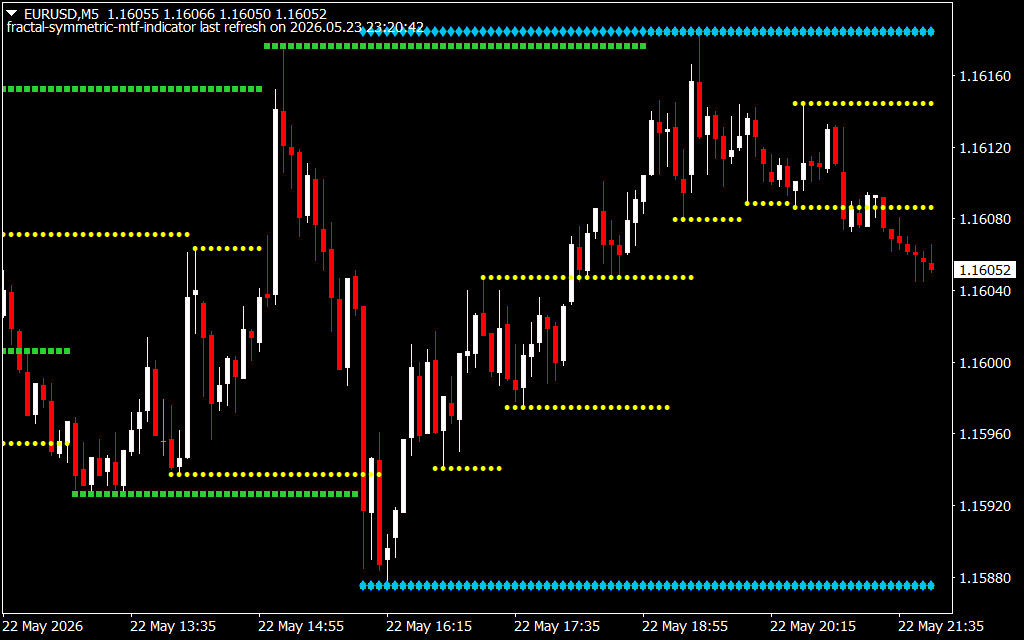
As displayed on the EURUSD 5-minute (M5) chart, the indicator transforms complex market data into a highly responsive visual map overlayed directly onto the Price Action. Instead of drawing heavy, obstructive trend channels that block your view of raw price configurations, the tool displays clean, horizontal dot-matrix arrays:
- Vibrant Green and Light Blue Dot Horizons: Track macro structural boundaries and heavy institutional liquidity pools. When price tests these major unmoving baselines, it signals prime locations for deep value entries or high-probability swing reversals.
- Yellow Dotted Intraday Steps: Map out the shifting, localized support and resistance ceilings that develop throughout the trading session. These dynamic steps highlight where the market is establishing new value or shifting its balance of power.
This specific layout allows day traders and scalpers to instantly distinguish between major macro targets and immediate intraday levels. You can easily keep an eye on order blocks and raw candle rejections because your main chart workspace remains incredibly clean and readable.
Implementing a Discipline-Driven Technical Strategy
The Mt4 Fractal Symmetric indicator serves as a powerful foundation for automated or discretionary trading systems. It thrives when applied to two classic technical methodologies:
- Mean-Reversion Confirmed Setups: When price action stretches toward the extreme green or blue dot boundaries, traders can look for candlestick exhaustion patterns to trade price back toward the central yellow dotted arrays.
- Breakout Acceleration Matrix: When price breaks cleanly through an established yellow dot ceiling, it confirms a local shift in market symmetry, giving breakout traders an objective signal to scale into a fresh directional trend.
By standardizing support and resistance calculation across all charts, this tool eliminates human emotion and helps you manage risk with absolute mathematical discipline.
2 Downloads
Last Update:
May 24, 2026 02:22 AM
Published:
Jan 15, 2026 19:49 PM
Category: