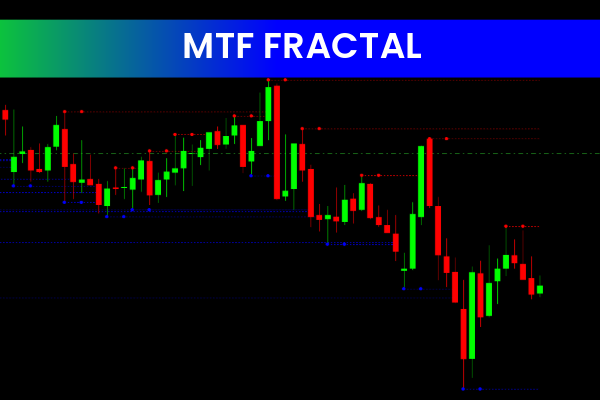
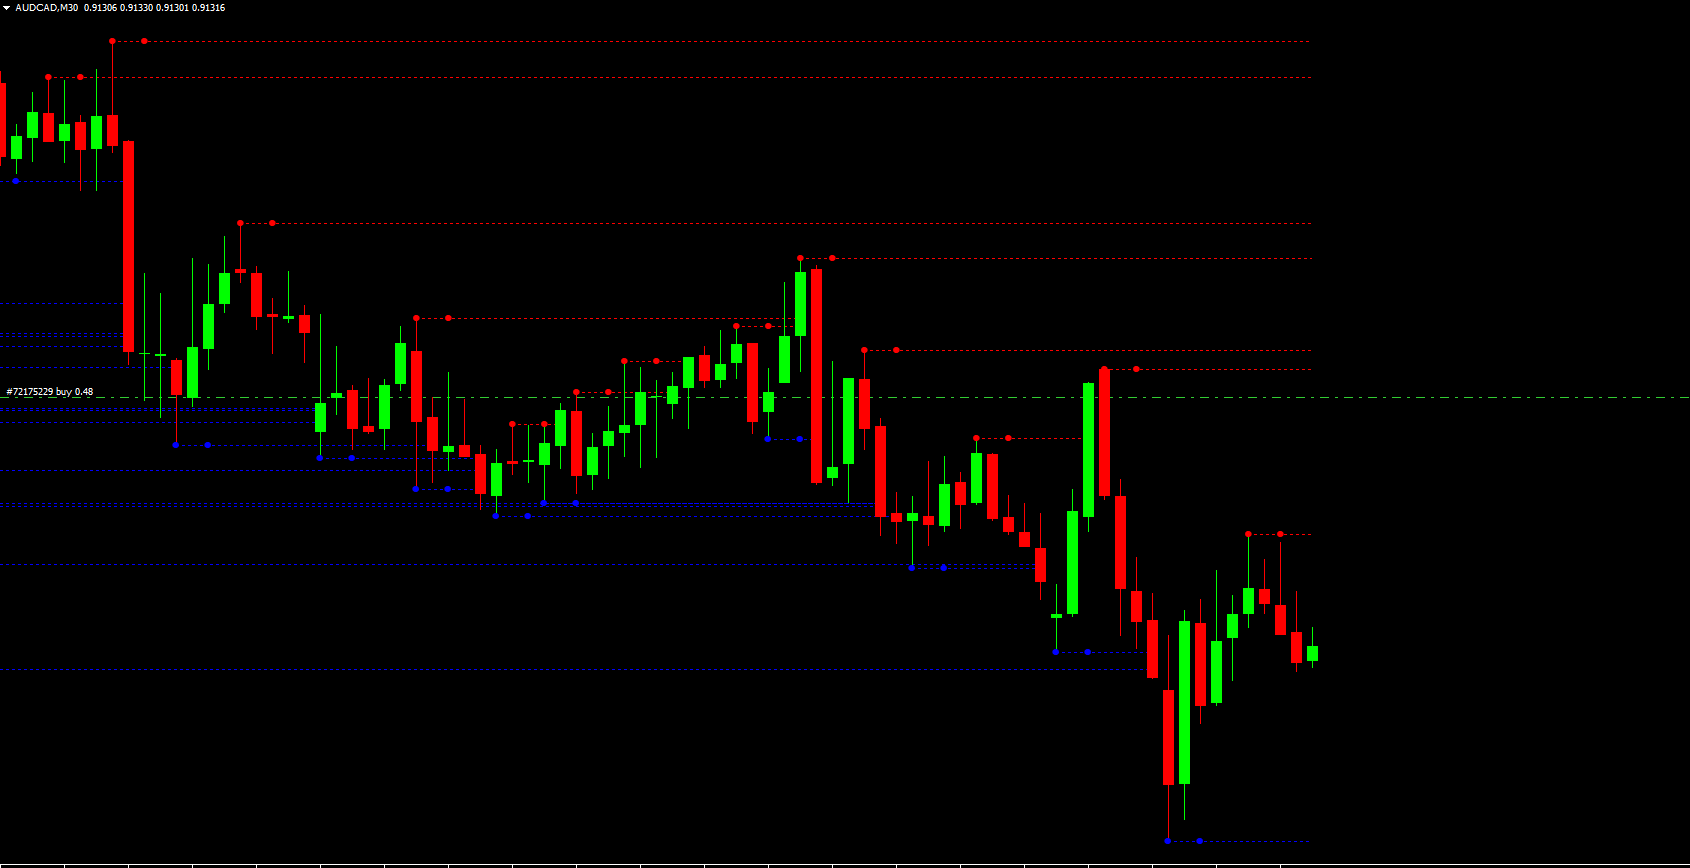
The MTF Fractal Indicator is a highly useful Forex tool for the MetaTrader 4 (MT4) platform. Designed to identify fractals across multiple timeframes, this indicator helps traders with trend analysis, as well as determining key Support And Resistance levels for more informed trading decisions.
Understanding the MTF Fractal Indicator
Fractals are patterns that mark significant highs and lows in the market. The MTF Fractal Indicator automatically detects these points and plots them on the chart, providing a clear visual representation of market turning points. By using multiple timeframes, traders can better understand the broader market trend while identifying precise entry and exit points.
Key Features of the MTF Fractal Indicator
Multi-Timeframe Fractals: Detects highs and lows across different chart periods.
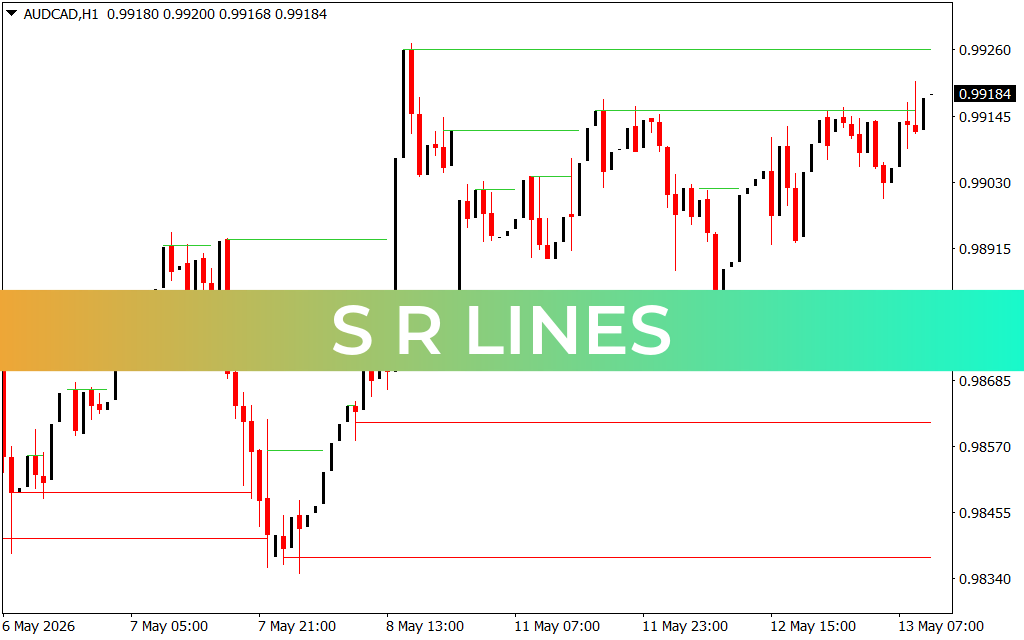
Support and Resistance Identification: Highlights key levels for trade planning.
Trend Analysis: Helps determine market direction using fractal patterns.
User-Friendly: Clear signals make it suitable signal for both novice and advanced traders.
Benefits of Using the MTF Fractal Indicator
Improved Market Analysis: Spot significant highs and lows to anticipate price movements.
Enhanced Trade Timing: Identify potential entries and exits across multiple timeframes.
Visual Clarity: Fractals are plotted directly on the chart for easy interpretation.
Versatile Application: Useful for Scalping, intraday, and swing trading strategies.
How to Use the MTF Fractal Indicator Effectively
Combine the MTF Fractal Indicator with other technical analysis tools, such as moving averages, trend lines, or oscillators, to confirm trends and potential reversals. Use the fractal points to set stop-loss and take-profit levels, improving overall risk management.
Download the MTF Fractal Indicator from IndicatorForest.com to enhance your Forex trading strategy and accurately identify market turning points across multiple timeframes.
FAQ
The MTF Fractal Indicator automatically detects fractals (significant highs and lows) across multiple timeframes and plots them on the chart. Fractals mark significant turning points in the market, helping traders identify key support and resistance levels and determine market direction using fractal patterns.
By detecting fractals across different chart periods, traders can better understand the broader market trend while identifying precise entry and exit points. Higher timeframe fractals show major market structure, while lower timeframe fractals help fine-tune entries, improving overall trade accuracy.
Fractals highlight key levels for trade planning by marking significant highs and lows. These levels often act as support and resistance where price may react strongly, making them useful for setting entry, exit, and stop-loss levels. The visual clarity of fractals plotted directly on the chart makes interpretation easy.
Combine the MTF Fractal Indicator with other technical analysis tools such as moving averages, trend lines, or oscillators to confirm trends and potential reversals. Use the fractal points to set stop-loss and take-profit levels, improving overall risk management and trade quality.
Yes, the clear signals make it suitable for both novice and advanced traders. Fractals are plotted directly on the chart for easy interpretation, and the indicator is useful for scalping, intraday, and swing trading strategies, making it versatile for traders at all experience levels.
2 Downloads
Published:
Dec 16, 2025 01:14 AM
Category: