Master Market Structure with the S R Lines Indicator
In the world of technical analysis, price action often feels like a chaotic dance. However, professional traders know that the market has a memory. It frequently reacts to specific price levels where significant buying or selling occurred in the past. These zones are known as Support And Resistance. The S R Lines indicator is a vital technical tool designed to automatically identify and plot these horizontal "floors" and "ceilings" on your chart, providing a clear map of where price is likely to stall, reverse, or breakout.
The Foundation of Support and Resistance
Support and Resistance (S&R) are the bread and butter of market structure.
- Support (The Floor): This is a price level where a downtrend tends to pause due to a concentration of demand. As price drops toward support, buyers become more inclined to buy, and sellers become less inclined to sell.
- Resistance (The Ceiling): Conversely, resistance is where an uptrend pauses due to a concentration of supply. As price approaches these levels, sellers enter the market in force, and buyers start taking profits.
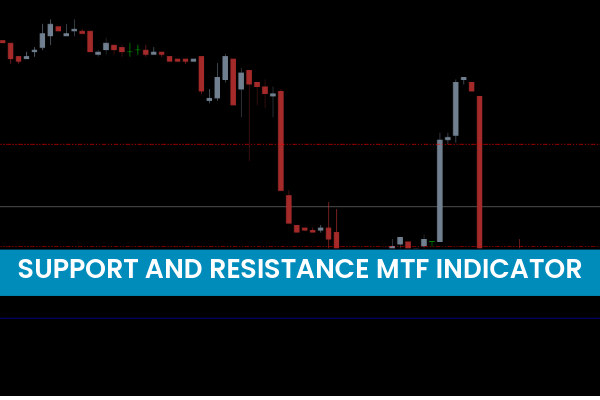
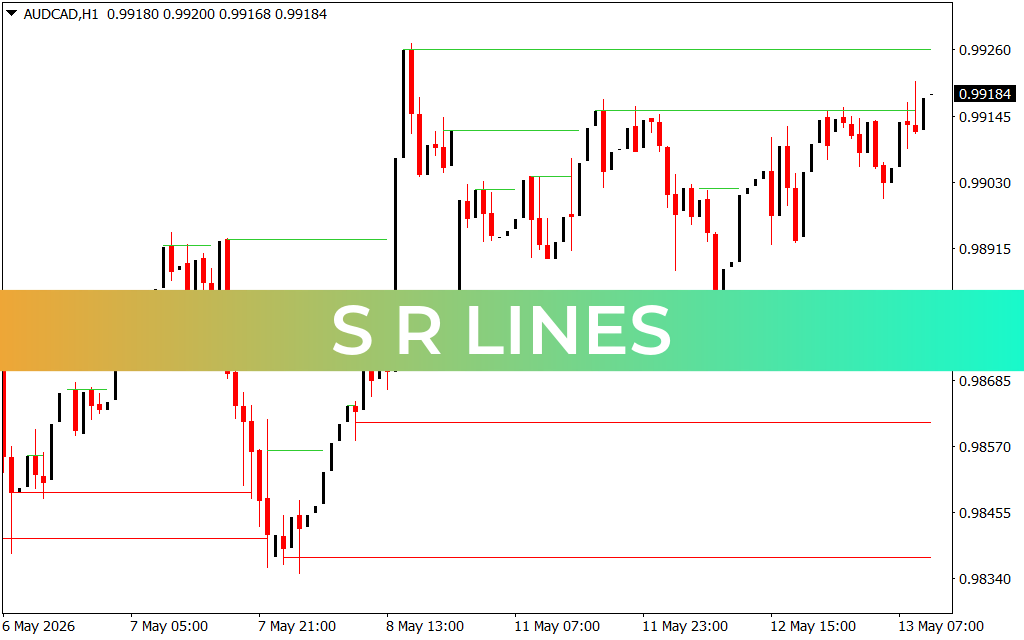
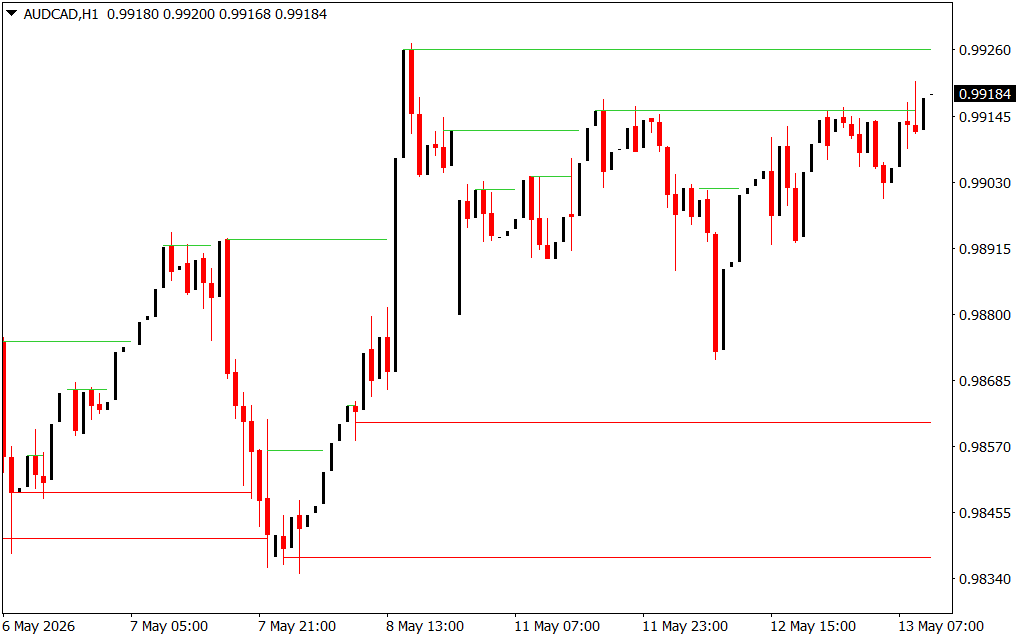
The S R Lines indicator automates the process of finding these pivots. Instead of manually drawing lines that might be subjective, the indicator uses historical price data to find high-probability reaction zones. As seen in the AUDCAD H1 chart, the indicator plots clean, horizontal lines: green lines typically represent resistance levels above current price, while red lines represent support levels below.
Why Every Trader Needs Automated S&R
One of the biggest challenges for developing traders is identifying relevant levels. A chart can have dozens of minor peaks and valleys, but not all are significant. The S R Lines indicator filters out the noise, focusing on the levels that have successfully rejected price multiple times.
- Predicting Reversals: By knowing where the "walls" are located, traders can anticipate reversals before they happen. If price is approaching a major green resistance line on the H1 chart, a savvy trader will look for bearish candlestick patterns or momentum shifts to trigger a short entry.
- Setting Precise Targets: S&R levels provide natural logic for stop-losses and take-profits. A common strategy involves placing a stop-loss just behind a support line and a take-profit target just before the next resistance line.
- Breakout Confirmation: When price finally breaks through a long-standing S&R line, it often signals a significant trend shift. The S R Lines indicator helps you visualize these breakouts as they happen, ensuring you don't miss high-velocity moves.
Enhancing Your Strategy
The S R Lines indicator is most powerful when used as a foundation for confluence. For example, if price hits a red support line and the Corrected RSX simultaneously shows an oversold turnaround, the probability of a successful long trade is greatly enhanced. On lower timeframes like the EURUSD M15, these lines help scalpers identify quick "ping-pong" opportunities between established levels.
Conclusion
Trading without Support and Resistance is like driving in a new city without a GPS. The S R Lines indicator provides the coordinates you need to navigate the markets with confidence. By automating the identification of these psychological price levels, it allows you to focus on execution and risk management. Integrate the S R Lines indicator into your MetaTrader platform today to start trading with a structural advantage.
8 Downloads
Last Update:
May 13, 2026 14:11 PM
Published:
Jan 23, 2026 01:32 AM
Category: