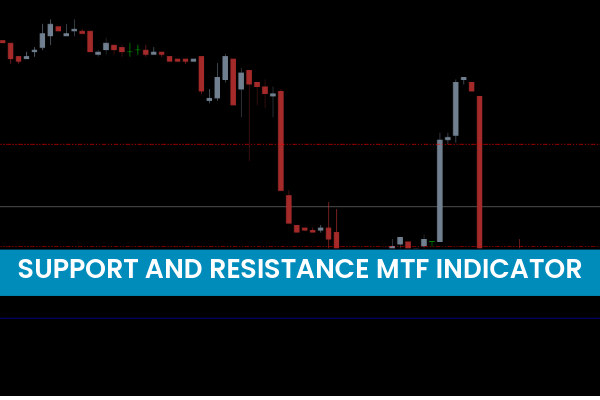
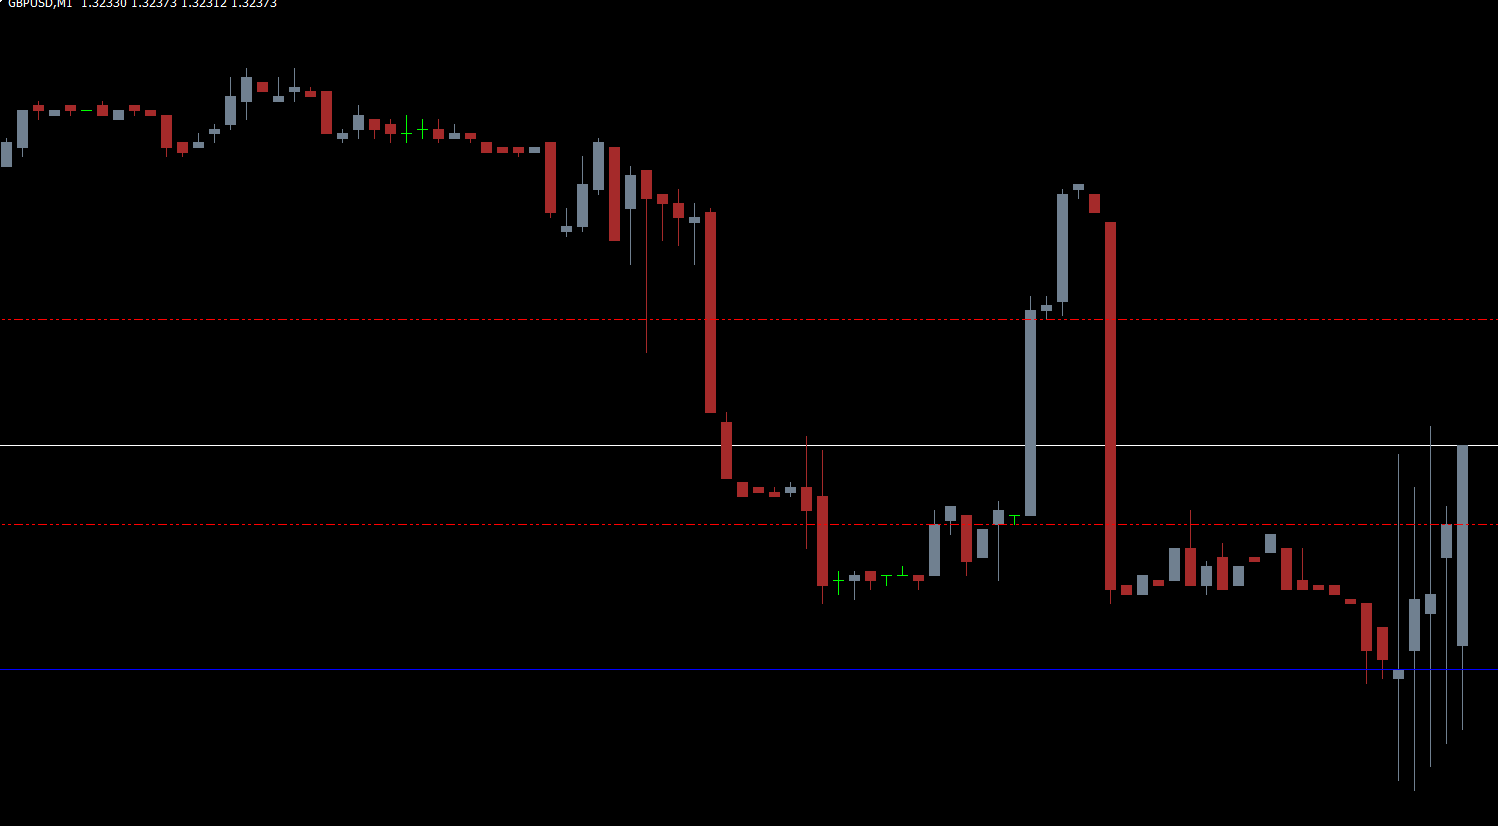
The Support And Resistance MTF Indicator for MT4 is a powerful tool that displays multi-timeframe support and resistance levels on a single chart. Because these zones align across several timeframes, they are considered highly reliable and help traders determine the strongest entry and exit points. The indicator allows forex traders to analyze Price Action, identify trend direction, and recognize reversal or breakout opportunities—all without switching charts.
Modern traders understand that support and resistance levels from higher timeframes hold stronger value. For example, a support level that appears on both H1 and H4 charts becomes more significant and offers high-probability BUY opportunities. The Support and Resistance MTF Indicator visually combines these levels, making technical analysis faster, cleaner, and more efficient.
How the Support and Resistance MTF Indicator Works
The indicator performs well on intraday timeframes such as M15, M30, and H1, as well as higher timeframes like the Daily, Weekly, and Monthly charts. It automatically plots blue lines for support and red dotted lines for resistance, giving traders a clear view of potential turning points.
Both new and experienced forex traders gain excellent benefits using this indicator. Beginners enjoy easy visual interpretation of bullish and bearish zones, while advanced traders integrate it into automated trading strategies or confluence-based systems.
Trading Signals and Market Interpretation
The Support and Resistance MTF Indicator for MT4 offers two popular trading approaches:
Breakout Trading Strategy
Breakout trading occurs when the price breaks through a multi-timeframe support or resistance level.
When to BUY:
Enter a long position when the price breaks above a resistance zone
Set stop loss below the previous support
Target the next resistance zone for take profit
A breakout above a strong MTF resistance often signals a bullish continuation pattern.
When to SELL:
Enter a short position when the price breaks below a support zone
Set stop loss above the broken resistance
Book profits at the next support line
A breakdown from strong MTF support usually indicates bearish momentum.
Reversal Trading Strategy
Reversal trading works when price fails to break a level and reverses direction.
Bullish Reversal (BUY):
Price fails to break support
Buyers regain control
Enter long trades after confirmation candles
Bearish Reversal (SELL):
Price fails to break resistance
Sellers show dominance
Enter short trades after a bearish rejection
This strategy works especially well with higher timeframe confluence.
Why Multi-Timeframe Support and Resistance Matter
Higher timeframe zones are more reliable than single-timeframe levels
Helps traders avoid false signals
Improves the accuracy of trend-based setups
Offers precise levels for stop loss and take profit planning
Enhances decision-making for both intraday and swing trades
This indicator is particularly useful for traders who want consistency in identifying Market Structure, trend strength, and potential reversal points.
Final Thoughts
The Support and Resistance MTF Indicator for MT4 is an essential tool for traders looking to strengthen their technical analysis. It simplifies identifying multi-timeframe zones, enhances trend recognition, and delivers highly accurate BUY and SELL opportunities. The indicator is free to download and an excellent addition to any trading strategy.
To explore more advanced tools and premium forex indicators, visit IndicatorForest.com.
FAQ
1 Download
Published:
Nov 28, 2025 20:46 PM
Category: