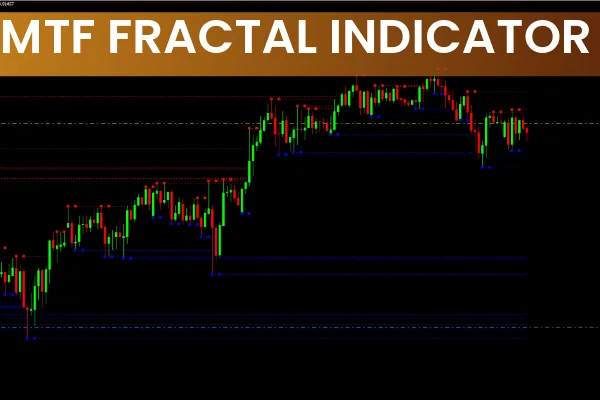
The MTF Fractals indicator is a powerful multi-timeframe tool designed to help traders identify potential trend reversals and retracements with higher accuracy. By displaying fractals from several timeframes on a single chart, the MTF Fractals indicator gives users a holistic view of Market Structure. This makes analyzing trend continuation or the emergence of new trends easier and more efficient, especially compared to using a standard single-timeframe fractal indicator.
Fractals are widely used in algorithmic trading, MetaTrader 4 (MT4) and MetaTrader 5 (MT5) strategies, and system-based approaches to technical analysis. With the MTF fractal setup, traders can view key turning points without switching charts—saving time while improving clarity.
How the MTF Fractals Indicator Works
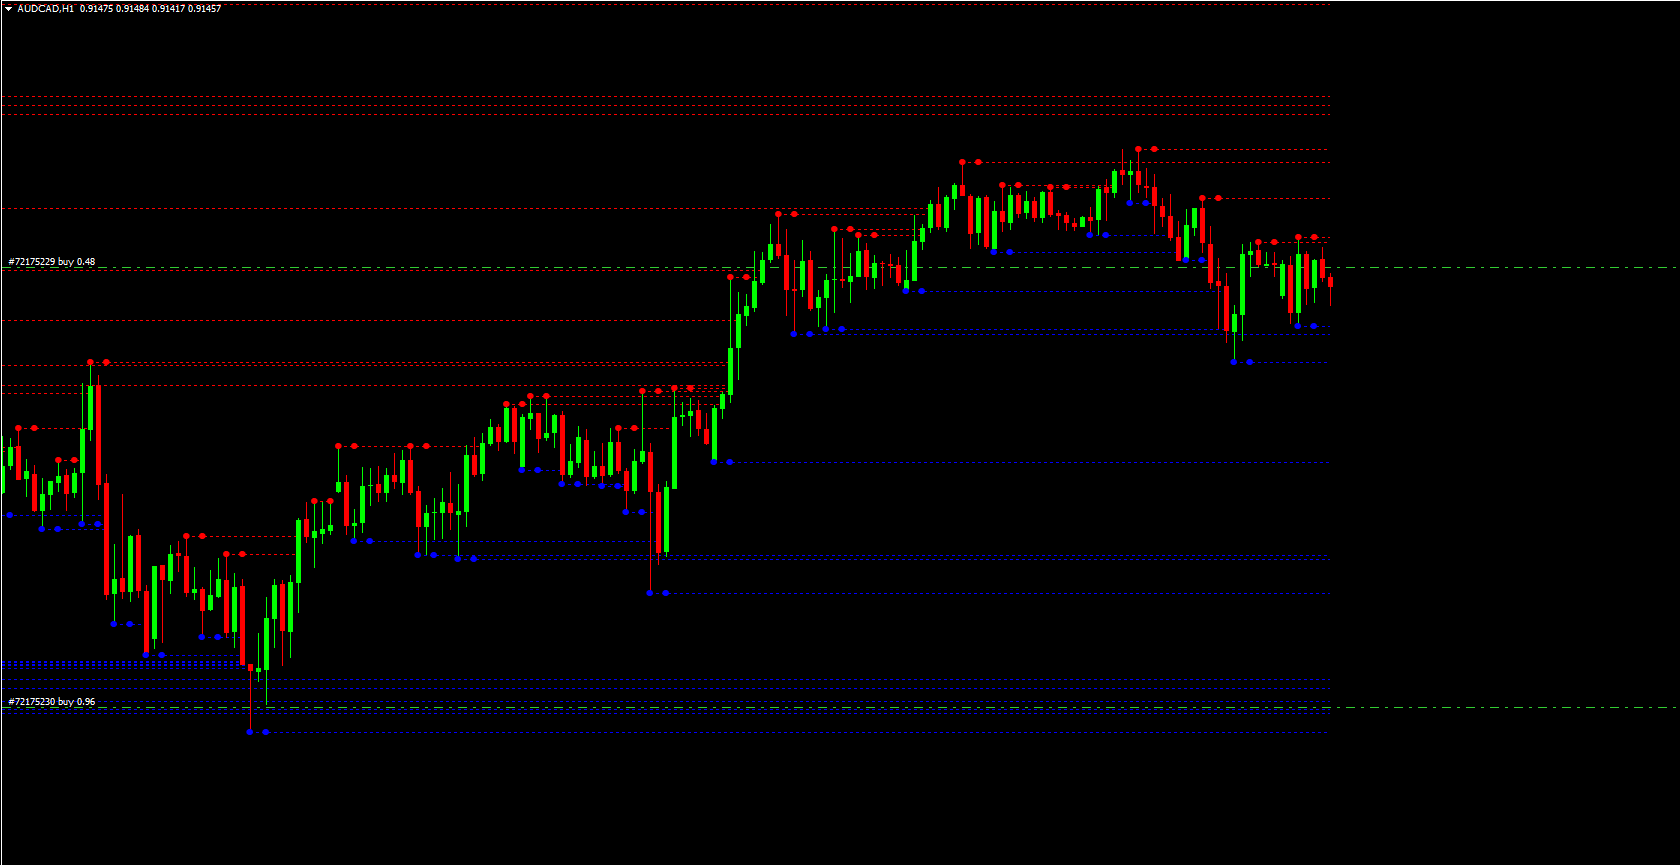
The MTF Fractals indicator plots fractal points from different selected timeframes onto your main chart.
Up fractals (typically red) indicate potential resistance or bearish turning points.
Down fractals (commonly blue) signal possible support or bullish reversal areas.
Hovering your mouse over a fractal line instantly shows which timeframe produced the fractal and the price level at which it formed. This feature is particularly useful for traders who rely on fractal theory, as it consolidates all fractal data into one clean interface without the need for multiple chart windows.
The indicator can also function as a component of a broader algorithmic trading system, helping traders refine entries, exits, and risk-management practices.
MTF Fractals Indicator Trading Strategy
Buy Setup (Bullish Scenario)
Identify an up fractal on the chart.
Wait for a bullish candle to close above that fractal’s support level.
Place a buy stop order a few pips above the high of the bullish candle.
Insert a stop-loss slightly below the fractal support.
Set a take-profit at the next resistance zone, or exit manually when a down fractal appears.
This method aligns with common strategies used in MT4/MT5 systems and helps traders capture early shifts from bearish to bullish sentiment.
Sell Setup (Bearish Scenario)
Identify a down fractal on the chart.
Wait for a bearish candle to close under the fractal’s resistance.
Place a sell stop order slightly below that candle’s low.
Set a stop-loss above the fractal resistance.
Close the trade manually when an up fractal forms or place take-profit at the nearest support.
This method captures bearish reversals or continuation moves with structured risk control.
Advantages of Using the MTF Fractals Indicator
Shows fractals from multiple timeframes simultaneously
No redrawing, resulting in more reliable signals
Fits seamlessly into MT4/MT5 trading systems
Helps identify early reversal zones
Useful for Scalping, day trading, and swing trading
Limitations and Best Practices
While the MTF Fractals indicator is highly accurate, no single tool should be used alone. Combine fractals with:
Moving averages
RSI or MACD
Price Action confirmation
Adding complementary tools increases precision and reduces false signals in volatile market conditions.
Conclusion
The MTF Fractals indicator is an essential trend-detection tool for traders who want deeper insight into multi-timeframe dynamics. Whether you trade Forex, commodities, or indices, this indicator can elevate your strategy—especially when combined with proper risk management and supporting tools.
To explore more professional indicators, expert advisors, and trading tools, visit IndicatorForest.com.
FAQ
6 Downloads
Published:
Dec 01, 2025 00:38 AM
Category: