Master Higher Timeframe Bias with MTF Moving Averages
In the fast-paced world of technical analysis, one of the biggest challenges traders face is "tunnel vision." It is incredibly easy to get caught up in the minor price fluctuations of a lower timeframe while completely missing a major Trend Reversal on a higher one. The MTF Moving Averages (Multi-Timeframe) indicator for MetaTrader is a professional-grade solution designed to eliminate this problem by projecting higher-timeframe trends directly onto your current chart.
Why Multi-Timeframe Analysis Matters
Successful trading is built on the foundation of "timeframe confluence." A seasoned trader knows that a bullish signal on a 15-minute chart is significantly more powerful if it aligns with the bullish momentum of the 1-hour or 4-hour trend. Traditionally, this required constantly switching between tabs, which can lead to missed entries and confusion.
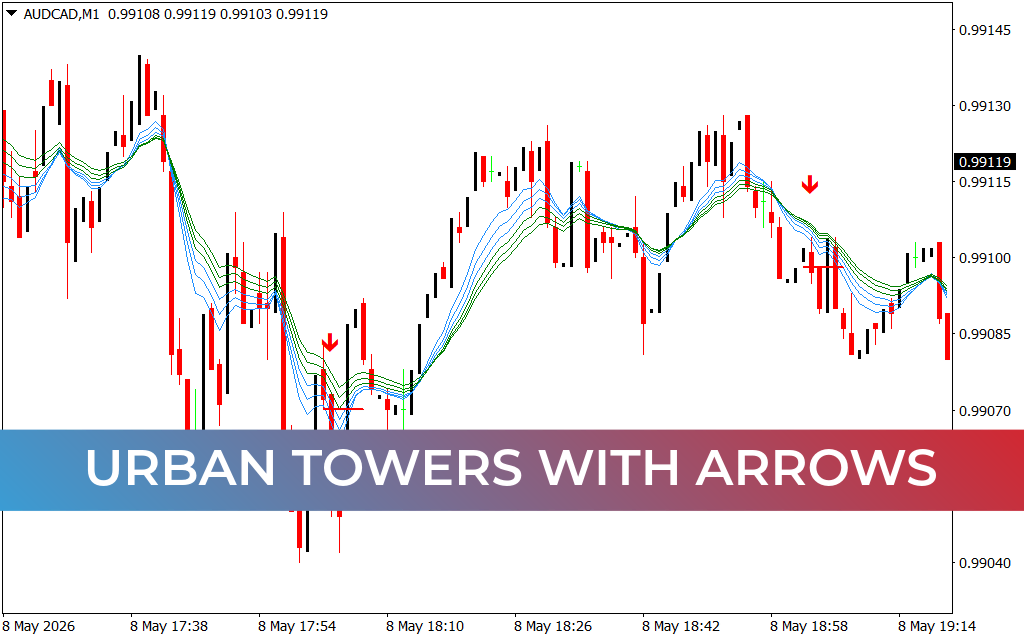
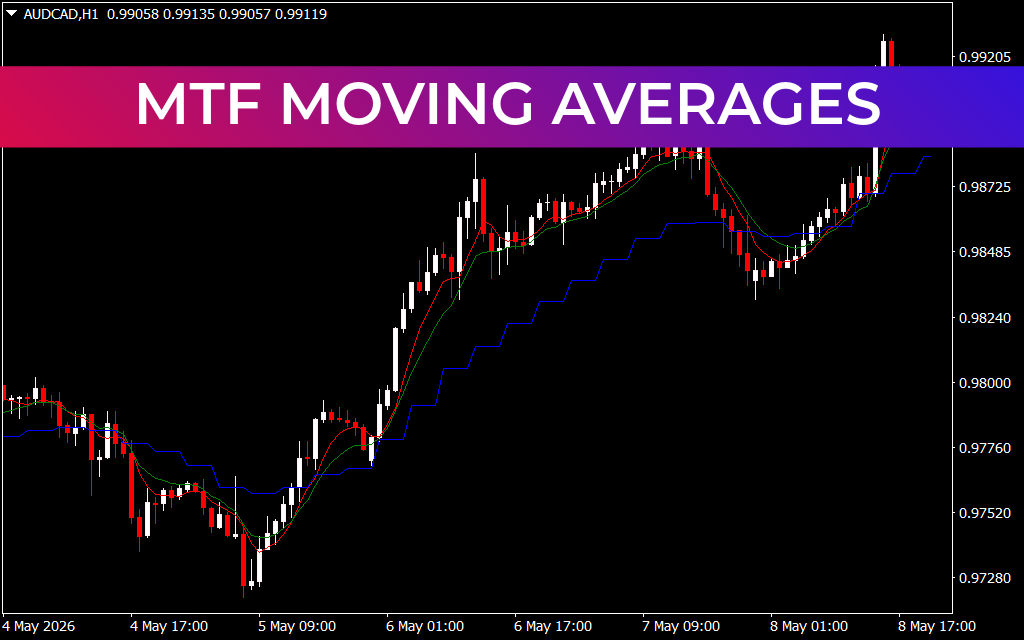
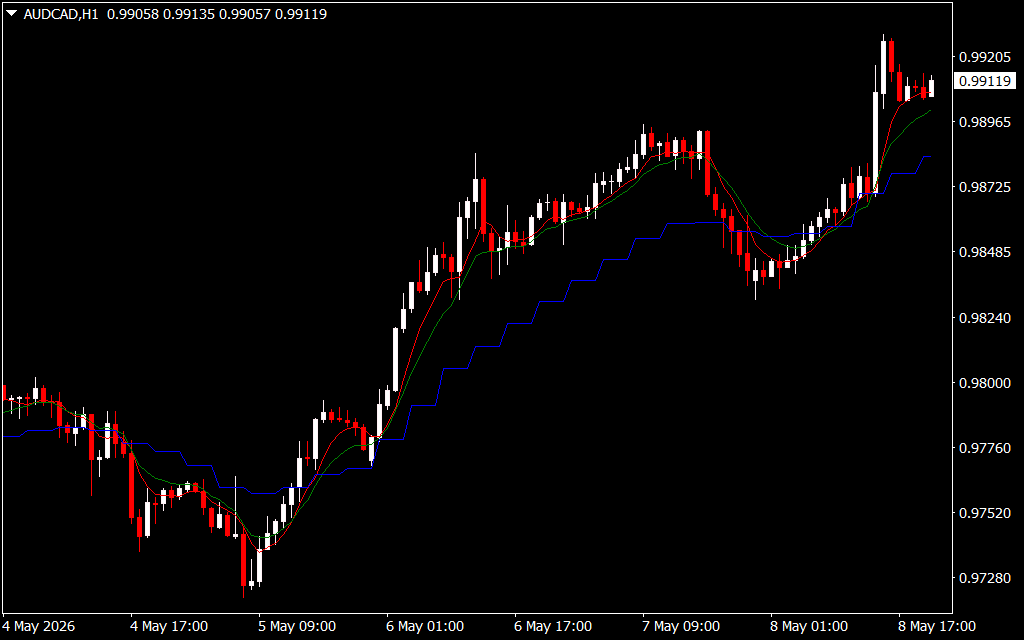
The MTF Moving Averages indicator simplifies this process. As seen on the H1 timeframe, the indicator plots multiple averages representing different time cycles—such as the daily or weekly trend—using a unique "stepped" visual logic (the blue line) alongside smoother intraday averages (the green and red lines).
Key Features and Strategic Advantages
- Projected Higher-Timeframe Data: The standout feature is the ability to see exactly where a Daily or 4-Hour moving average sits while you are looking at a 5-minute or 1-hour chart. This provides an instant "big picture" perspective.
- The "Stepped" Blue Line: Unlike standard averages that smooth out over time, the MTF Moving Averages indicator uses a stepped format for higher timeframes. This shows you the exact price level the higher-timeframe average held at each interval, providing rock-solid Support And Resistance levels.
- Instant Trend Confirmation: By using a combination of fast and slow MTF averages, you can identify "Trend Alignment." When the fast intraday lines (red/green) are trending in the same direction as the higher-timeframe stepped line (blue), you have a high-probability trade setup.
- Dynamic Support and Resistance: Higher-timeframe moving averages are closely watched by institutional traders. By having these levels on your chart, you are essentially seeing the "hidden" levels where big banks are likely to place their orders.
- Visual Clarity: The indicator is designed to be clean and intuitive. The color-coding allows you to distinguish between short-term momentum and long-term structural trends in a single glance.
Implementing the MTF Strategy
The most effective way to trade with MTF Moving Averages is to use the higher timeframe as a directional filter. For instance, if the blue stepped line (representing the Daily trend) is sloping upward, you should focus strictly on "buy" setups. You can then use the crossover of the faster green and red lines as your precise entry trigger.
This "top-down" approach ensures that you are never trading against the dominant market force, significantly reducing the risk of being caught in a "whipsaw" or a false breakout.
Conclusion
Precision in trading comes from context. The MTF Moving Averages indicator provides that context by bridging the gap between timeframes. It transforms a simple chart into a multi-dimensional analysis tool, allowing you to trade with the confidence of a professional who sees the whole market, not just the current candle. Upgrade your MetaTrader toolkit today and stop trading in the dark.
1 Download
Last Update:
May 09, 2026 21:14 PM
Published:
Jan 24, 2026 22:47 PM
Category: