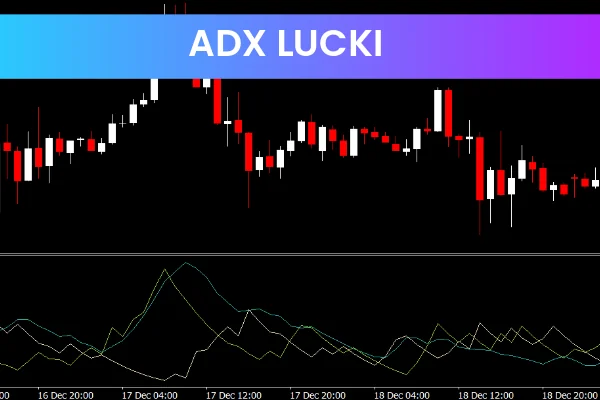
The ADX Lucki Indicator is a popular and free Forex Indicator for the MetaTrader 4 (MT4) platform. It is designed to help traders identify trending markets and determine the strength and direction of a trend. By using a combination of the Average Directional Movement Index (ADX) and the Directional Movement Index (DMI), this indicator provides valuable insights into market behavior, making it easier for traders to make informed decisions.
This indicator is suitable for traders of all levels who want to improve trend analysis and spot profitable trading opportunities.
What Is the ADX Lucki Indicator?
The ADX Lucki Indicator is a technical analysis tool that combines two key components:
ADX Line (Blue): Measures the strength of a trend. A reading above 25 indicates a strong trend, while a reading below 25 indicates a weak trend.
DMI Line (Red): Determines the direction of the trend. A value above 0 indicates an uptrend, while a value below 0 indicates a downtrend.
By combining these two lines, traders can easily identify strong trends and their direction, helping them decide whether to enter or exit a trade.
How the ADX Lucki Indicator Works
The indicator works by analyzing market price movements and calculating ADX and DMI values:
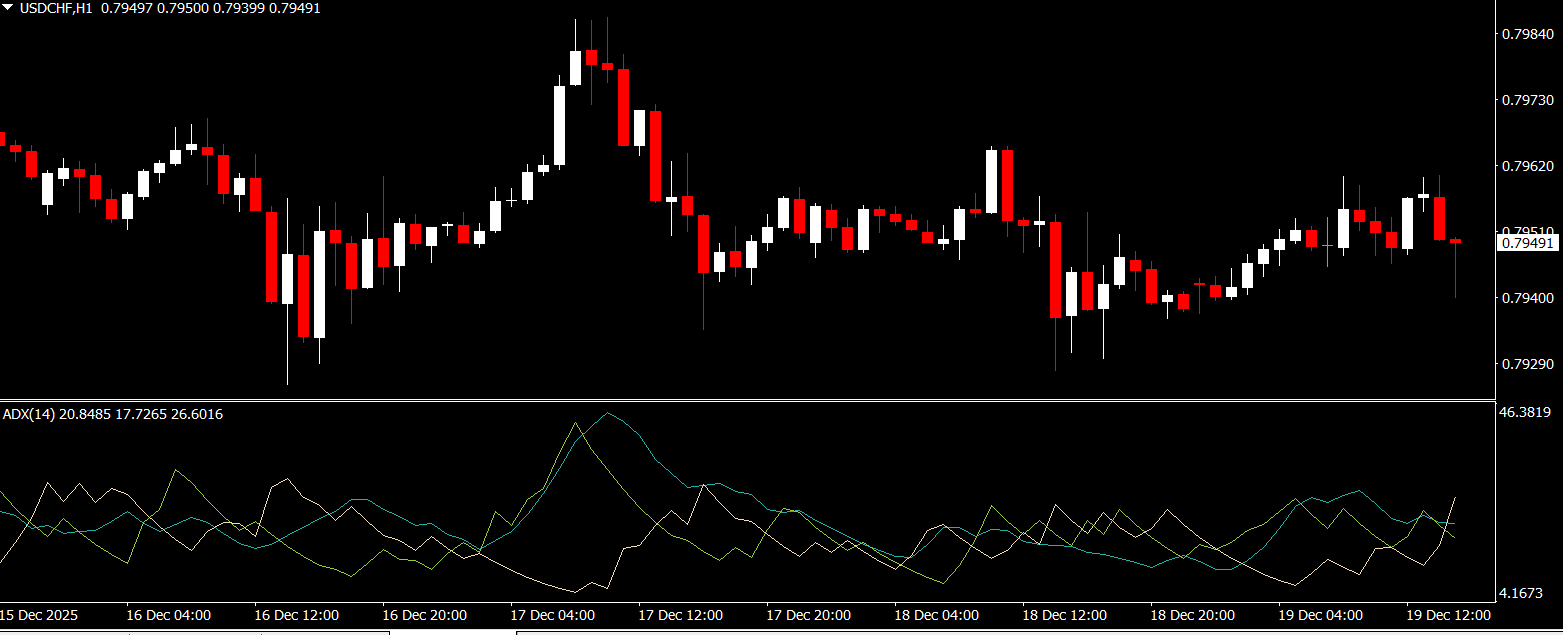
Trend Strength: The blue ADX line shows how strong the current trend is. Strong trends are ideal for trend-following strategies.
Trend Direction: The red DMI line shows whether the market is in an uptrend or downtrend, allowing traders to align their trades with market momentum.
When the ADX line crosses above 25 and the DMI confirms the trend direction, it signals a strong trend that traders can capitalize on. Conversely, low ADX readings indicate weak trends or range-bound markets.
Key Features of ADX Lucki Indicator
The ADX Lucki Indicator provides several features that make it effective for Forex trading:
Free Forex indicator for MT4
Measures trend strength using ADX
Determines trend direction using DMI
Helps identify trending and range-bound markets
Easy to interpret with clear blue and red lines
Works on all currency pairs and timeframes
Easy to install and use for traders of all levels
These features make it an essential tool for trend-following strategies, breakout trading, and market analysis.
How to Install and Use ADX Lucki Indicator on MT4
Installing the ADX Lucki Indicator is straightforward:
Add the indicator to your MT4 platform
Open a currency pair chart
Select your preferred timeframe
Apply the indicator to the chart
Once applied, the indicator automatically calculates and displays the ADX and DMI lines in real time, allowing traders to analyze market trends quickly.
Trading Strategies Using ADX Lucki Indicator
Traders can use the ADX Lucki Indicator in various ways:
Trend-Following Trades: Enter trades when the ADX line is above 25 and the DMI confirms trend direction
Avoid Sideways Markets: Use low ADX readings to stay out of weak or range-bound markets
Trend Confirmation: Combine ADX Lucki with moving averages or other indicators to confirm trade setups
Using proper risk management in combination with the ADX Lucki Indicator can help traders improve accuracy and profitability.
Advantages and Limitations
The main advantage of the ADX Lucki Indicator is its ability to clearly identify trend strength and direction, simplifying trend analysis for traders.
However, it may produce limited signals in low-volatility or sideways markets. Traders level should combine it with other confirmation tools and maintain proper risk management.
Why Use ADX Lucki Indicator from IndicatorForest.com
At IndicatorForest.com, traders can access reliable and high-quality MT4 indicators. The ADX Lucki Indicator is a valuable tool for identifying trending markets, making it easier to trade with confidence.
👉 Visit IndicatorForest.com to explore more free and premium MT4 indicators designed to enhance your Forex trading strategies.
FAQ
Published:
Dec 19, 2025 10:00 AM
Category: