Master Market Context with the Multi-Period RSI Indicator for MetaTrader
In the world of technical analysis, the Relative Strength Index (RSI) is a staple. However, standard RSI indicators often trap traders into "tunnel vision," where they focus solely on the current timeframe while ignoring the broader market sentiment. The Multi-Period RSI is a game-changing tool designed to solve this exact problem, allowing traders to view higher-timeframe momentum directly on their lower-timeframe execution charts.
What is the Multi-Period RSI?
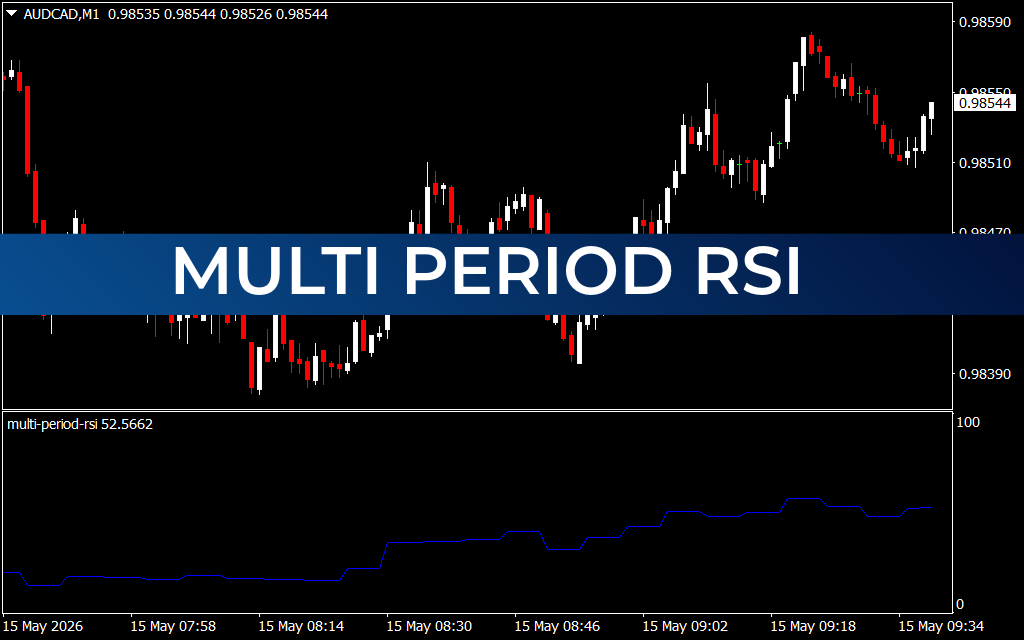
The Multi-Period RSI is an advanced technical indicator for MetaTrader that calculates and displays RSI values from a timeframe higher than the one currently being viewed. For example, if you are trading the M1 timeframe (as seen in the AUD/CAD chart), the indicator can plot the RSI of the M15, H1, or even the Daily chart as a secondary window.
Instead of a jagged, fluctuating line, the Multi-Period RSI often appears as a "stepped" line. This visual representation reflects the higher timeframe’s RSI value as it updates, providing a stable foundation for trend analysis.
Why Multi-Period Analysis Matters
Trading without knowing the higher-timeframe trend is like driving a car while only looking at the front bumper. You might see the immediate obstacles, but you miss the upcoming curves. The Multi-Period RSI provides the following advantages:
- Filter Out Noise: Intraday Price Action on the M1 or M5 can be incredibly noisy. A Multi-Period RSI smoothed over an H1 period helps you ignore minor fluctuations and stay aligned with the "big money" flow.
- Identify Confluence: The most powerful trade setups occur when the short-term RSI and the higher-period RSI move in the same direction. When both are above 50, the bullish conviction is significantly higher.
- Precise Entries and Exits: Use the higher timeframe to determine the trend direction and the lower timeframe price action to time your entry. This "top-down" approach is a hallmark of professional trading.
How to Trade Using Multi-Period RSI
- Trend Confirmation: If the Multi-Period RSI is trending upward and holding above the 50 level, look exclusively for buy setups on your price candles.
- Overextended Markets: When the stepped line reaches extreme levels (above 70 or below 30), it signals that the higher-timeframe trend may be reaching exhaustion, alerting you to tighten your stop losses.
- The "Step" Break: A significant shift or "step" in the indicator often precedes a breakout in price, giving scalpers a head start on the coming volatility.
Conclusion
The Multi-Period RSI is an essential upgrade for any trader’s toolkit. By integrating multi-timeframe analysis into a single window, it simplifies your workflow and keeps you on the right side of the market trend. Whether you are a scalper looking for quick pulses or a day trader seeking trend confirmation, this indicator provides the clarity needed for consistent success.
1 Download
Last Update:
May 15, 2026 12:40 PM
Published:
Jan 22, 2026 00:29 AM
Category: