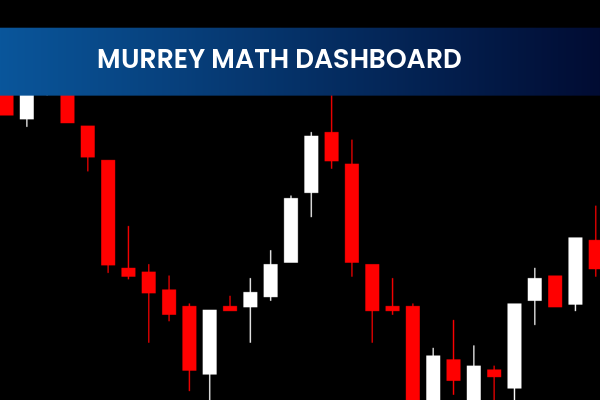
The Murrey Math Dashboard Indicator is a popular and free Forex tool for traders using MetaTrader 4 (MT4). It is designed to help traders quickly identify trends, potential reversals, and key Support And Resistance levels.
Based on Murrey Math lines, this indicator provides a comprehensive dashboard that displays critical market information at a glance. Traders can use this tool to make informed decisions, improve timing for trades, and increase the probability of successful market entries and exits.
How the Murrey Math Dashboard Indicator Works
The Murrey Math Dashboard Indicator uses a combination of Murrey Math lines and other market data to provide a detailed trading overview:
Murrey Math Lines: Predict potential reversal points and market pivots.
Trend Direction: Clearly displays whether the market is trending upward, downward, or sideways.
Support and Resistance Levels: Highlights critical levels where Price Action may reverse or stall.
Price Information: Displays the current price and its relation to key Murrey Math levels.
Overbought/Oversold Conditions: Helps traders identify when a market may be due for a reversal.
The dashboard consolidates this information into an easy-to-read visual display, making it suitable for both novice and experienced traders.
Benefits of Using the Murrey Math Dashboard Indicator
Traders use this indicator for several advantages:
Quick Market Analysis: Instantly view trend direction, support/resistance levels, and potential reversals.
Identify Entry and Exit Points: Provides signals for safer trade entries and exits.
Adaptable to Any Timeframe: Works well on short-term, intraday, and long-term charts.
Trend and Reversal Detection: Highlights overbought and oversold conditions to anticipate market moves.
User-Friendly Dashboard: No complicated setup required; the indicator is ready to use once installed on MT4.
Best Practices for Trading with Murrey Math Dashboard Indicator
To make the most of the Murrey Math Dashboard Indicator:
Confirm trend signals with other indicators such as ADX, EMA Cross, or Super Trend.
Use multiple timeframes to ensure trend consistency and stronger confirmation.
Combine with support/resistance levels or pivot points for precise trade execution.
Avoid trading during flat markets when Murrey Math lines are closely packed, as signals may be weaker.
Why Traders Prefer the Murrey Math Dashboard Indicator
The Murrey Math Dashboard Indicator is favored because it simplifies complex market data into a single, easy-to-read interface. Traders can monitor multiple market conditions without analyzing multiple charts, making it a time-saving and efficient tool.
With this indicator, Forex traders can spot trends, anticipate reversals, and identify key support and resistance levels, giving them a strategic edge in the markets.
Published:
Jan 05, 2026 13:26 PM
Category: