Mastering Multi-Timeframe Analysis with the CCI Dashboard Indicator for MT4
In the complex ecosystem of Forex trading, the ability to gauge market sentiment across multiple timeframes is a defining characteristic of successful traders. While individual oscillators provide a localized view of momentum, professional traders look for confluence—the alignment of signals from the M1 up to the Daily (D1) charts. The CCI Dashboard Indicator for MetaTrader 4 (MT4) is a premier analytical tool that condenses this vast amount of data into a single, easy-to-read visual interface, allowing you to monitor the entire market at a glance.
The Power of the Commodity Channel Index (CCI)
The Commodity Channel Index (CCI) is a versatile momentum-based oscillator used to identify overbought and oversold levels, as well as Trend Strength. However, checking every timeframe manually is time-consuming and prone to human error. The CCI Dashboard automates this process by scanning various currency pairs and timeframes simultaneously, calculating real-time values, and displaying them in a structured grid.
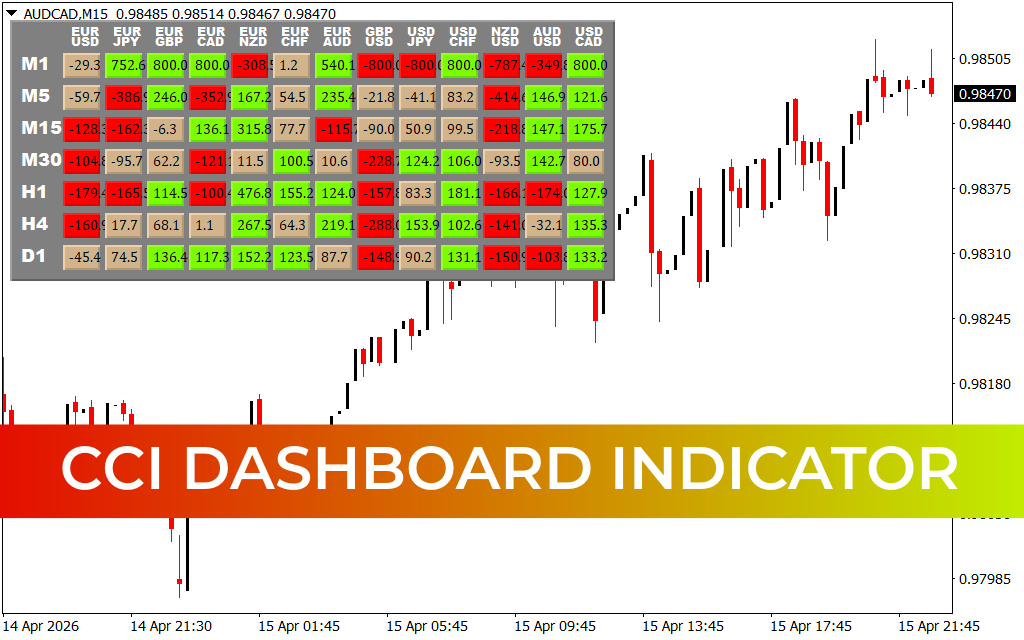
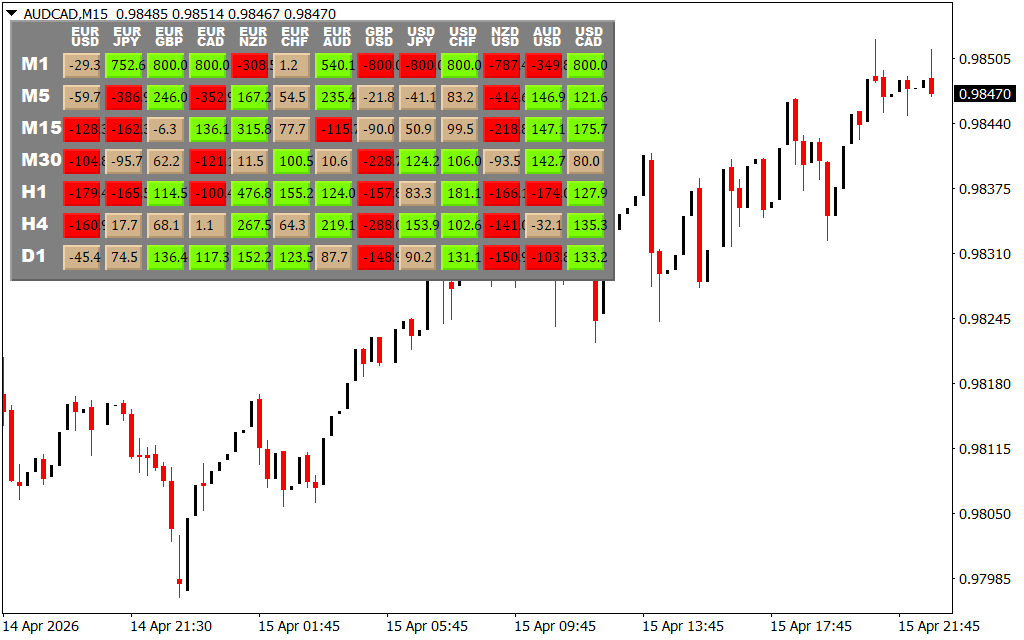
As seen in the recent AUD/CAD M15 chart analysis, the dashboard provides a comprehensive heat map of market strength:
- The Multi-Pair Matrix: The dashboard tracks a wide array of majors and crosses, including EUR/USD, GBP/JPY, and AUD/CAD, ensuring you never miss a setup on any relevant pair.
- Timeframe Confluence (M1 to D1): By displaying data from the 1-minute chart up to the Daily chart, the indicator helps you identify structural shifts. For example, if AUD/CAD shows bullish green values across M30, H1, and H4, you have a high-probability trend-following environment.
- Color-Coded Sentiment: The grid uses intuitive color-coding. Bright green represents strong bullish momentum, red indicates bearish pressure, and neutral tones signal consolidation or a lack of trend.
Strategic Advantages for the Modern Trader
Integrating the CCI Dashboard into your MT4 workspace offers several professional advantages:
- Instant Opportunity Identification: Instead of flipping through dozens of charts, the dashboard alerts you to pairs that are reaching extreme overbought or oversold conditions instantly.
- Trend Filtering: One of the most common mistakes is trading against the higher-timeframe trend. The CCI Dashboard serves as a "gatekeeper," ensuring that your M15 entries are aligned with the dominant H4 or D1 momentum.
- Enhanced Scalping Precision: For scalpers, the dashboard is invaluable. It allows you to see if a short-term spike on the M1 is supported by broader market volume, reducing the risk of being caught in a "fakeout".
- Reduced Screen Fatigue: By consolidating your analysis into a single window, you can maintain focus on execution rather than data collection.
Conclusion
The CCI Dashboard Indicator is an essential piece of "real estate" for any serious MT4 trader’s chart. It transforms the Commodity Channel Index from a simple oscillator into a powerful, multi-dimensional market scanner. By providing clarity, speed, and confluence, this indicator helps you trade with the conviction of a professional.portunities.
14 Downloads
Last Update:
Apr 16, 2026 01:58 AM
Published:
Feb 12, 2026 21:21 PM
Category: