Navigating Market Geometry with the Murrey MTF Indicator
In the complex ecosystem of Forex trading, identifying objective Support And Resistance levels is often a major challenge for retail participants. Standard manual line drawing is prone to individual bias, frequently resulting in miscalculated entries or premature exits. The Murrey MTF Indicator solves this fundamental issue by introducing a mathematical system based on Murrey Math lines. By dividing Price Action into a structured geometric grid across multiple timeframes, this tool provides traders with a reliable roadmap of key reversal zones and trend acceleration fields.
The Math Behind Murrey Math Lines
The architectural framework of the Murrey MTF system is based on the observations of T. Henning Murrey, who expanded upon the geometric trading principles of W.D. Gann. The core theory dictates that all major financial markets move in harmony within an expansive square of eight ($8 \times 8$). The indicator processes the historical high and low values of an asset over a set lookback period and mathematically divides that price range into eight equal intervals, known as octaves or "eighths."
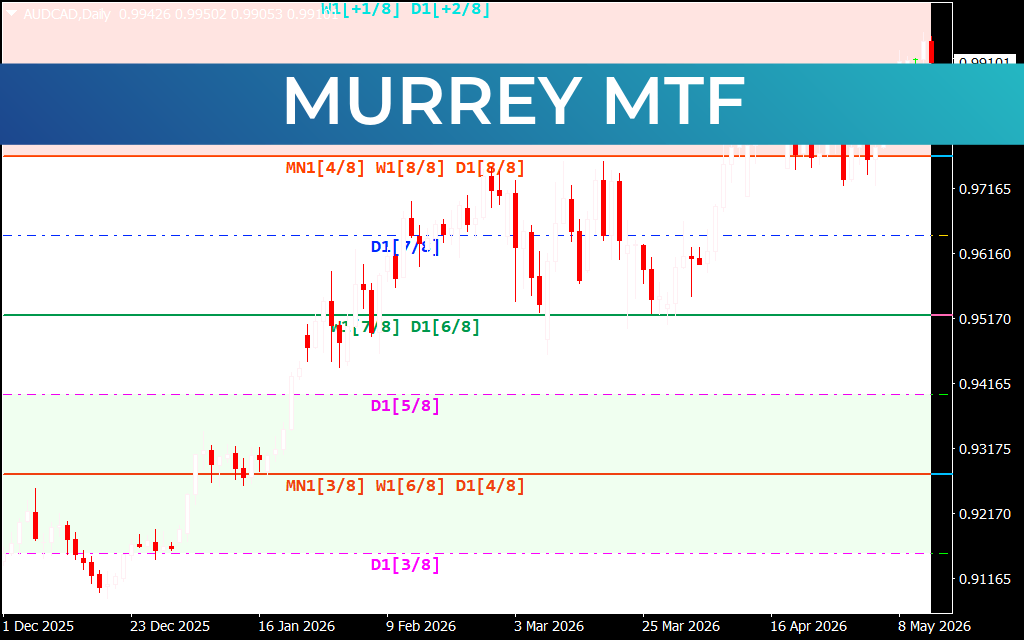
Because this is a multi-timeframe (MTF) version, the indicator overlay allows you to monitor macro octaves—such as Weekly (W1) or Monthly (MN1) baselines—directly on your current operational chart, whether it is a Daily layout or an intraday chart.
Understanding the Key Grid Thresholds
Each octave line within the Murrey MTF grid carries a precise technical meaning and a mechanical rule for price action:
- The Ultimate Baseline (4/8 Line): This center axis acts as the primary major support or resistance level. When price trades above the 4/8 line, the asset is operating in premium territory, favoring bullish continuation plays. When below, the asset is considered discounted, favoring bearish continuation.
- The Overbought and Oversold Boundaries (8/8 and 0/8 Lines): These horizons represent the hard mathematical edges of the current trading square. When a currency pair accelerates into these zones, it encounters extreme friction. Statistically, these are the hardest levels to break, making them premium zones for counter-trend reversals.
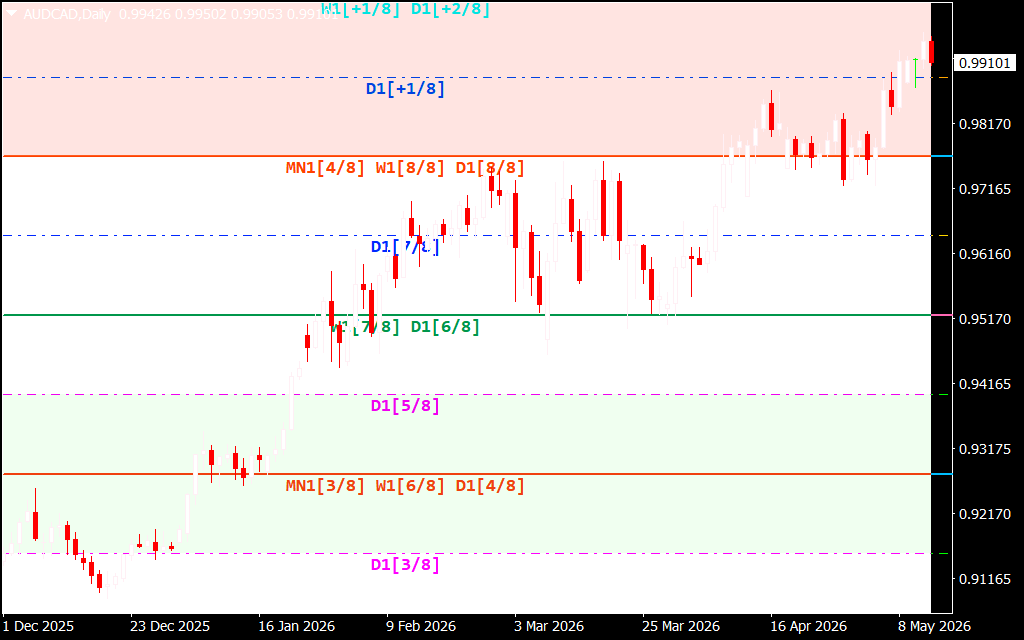
- The Overshoot Fields (+1/8 and +2/8 Lines): Highlighted visually as a prominent upper crimson field when a market pushes past normal limits, these expansion lines measure extreme overextended conditions. If price breaches the 8/8 line but stalls out near the +1/8 or +2/8 extensions, it signals severe institutional exhaustion, mapping out low-risk short opportunities.
Implementing Murrey MTF into Your Strategic Checklist
Integrating the Murrey MTF indicator into your daily routine establishes a clean, data-driven execution template:
- Precision Take-Profit Targets: Instead of guessing where an advance will fail, use the mathematical grid. If you enter a long position near a major fractional floor, the higher octave lines (such as 6/8 or 8/8) provide clear, objective target goals.
- Confluence Conduits: The indicator delivers maximum value when multiple timeframes line up. For instance, if a Daily D1[8/8] line aligns perfectly with a Weekly W1[4/8] baseline, that specific price zone represents an incredibly powerful structural wall where institutional order flow is highly likely to pivot.
Macro Structural Clarity on the Daily Chart
While scalable to lower intraday timeframes for fast-paced Scalping, the Murrey MTF Indicator delivers unmatched clarity on macro layouts like the Daily chart. As displayed on the AUD/CAD Daily structure, the indicator cleanly boxes a multi-month trend advance, marking the precise overhead thresholds where the macro cycle faces structural resistance. By outsourcing your level identification to automated Murrey Math logic, you can trade with absolute geometric confidence.
5 Downloads
Last Update:
May 14, 2026 21:27 PM
Published:
Jan 22, 2026 00:52 AM
Category: