Navigating Long-Term Trends with the Pivots Monthly Indicator
In the world of financial trading, the ability to distinguish between daily market noise and significant structural shifts is the hallmark of a successful trader. While short-term indicators have their place, professional swing traders and institutional investors often look to higher-timeframe benchmarks to guide their decisions. The Pivots Monthly indicator is one of the most reliable tools for identifying these critical price levels.
What are Monthly Pivot Points?
Pivot points are predictive indicators used to identify potential Support And Resistance levels. Unlike moving averages, which are lagging and based on past prices, pivot points use the high, low, and close prices of the previous period to calculate levels for the current period.
The Pivots Monthly indicator specifically uses data from the previous month to plot levels that remain fixed for the entire current month. This provides a consistent psychological and technical framework that thousands of market participants watch simultaneously.
Key Components of the Monthly Pivot System
- The Central Pivot Point (P): This is the primary focal point. Generally, trading above the monthly pivot suggests a bullish sentiment, while trading below it indicates a bearish outlook.
- Support Levels (S1, S2, S3): These levels act as floors where buying interest is expected to increase. In a trending market, S1 often acts as a pull-back entry point.
- Resistance Levels (R1, R2, R3): These act as ceilings where selling pressure typically mounts. Breaking through R1 on a monthly scale is often a signal of a powerful breakout.
Why Monthly Pivots Matter for H4 Traders
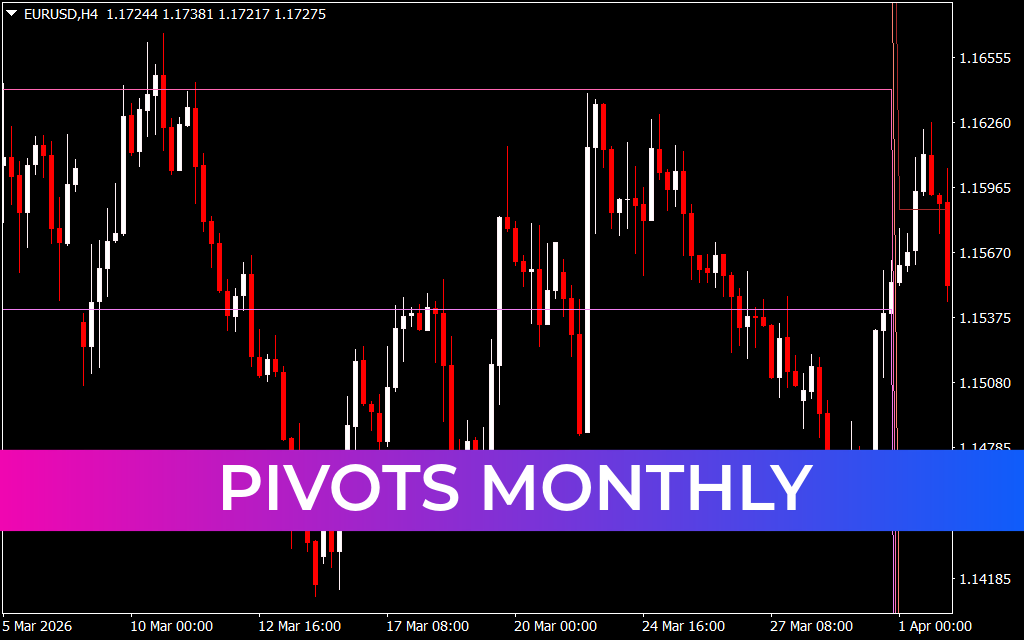
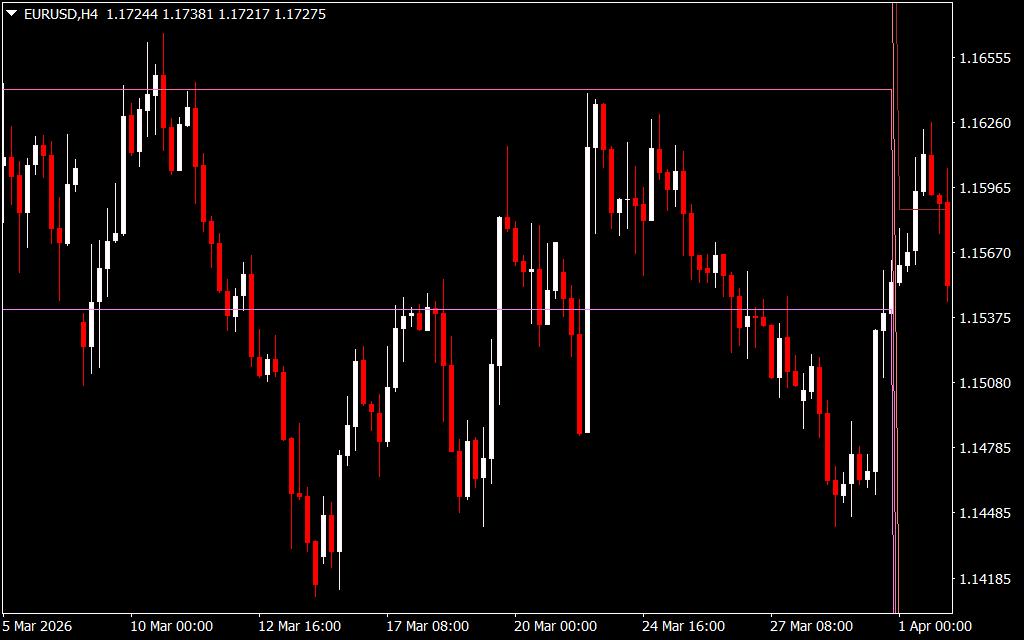
As seen in the EURUSD H4 chart, monthly pivots provide "macro" boundaries that contain Price Action for weeks at a time. While the H4 timeframe offers enough detail to spot candlestick patterns and entries, the monthly pivot lines provide the context.
For example, if the price is approaching a Monthly R1 level on the H4 chart and starts forming a reversal pattern, the probability of a successful short trade is significantly higher because you are trading at a major institutional horizontal barrier. Conversely, monthly pivots help traders avoid "buying the top" by showing exactly where the price is extended relative to its monthly average.
Practical Application and Strategy
The most effective way to use Pivots Monthly is in conjunction with price action. Traders look for "confluence"—where a monthly pivot level aligns with a trendline, a Fibonacci level, or a psychological round number. Because these levels are static for 30 days, they allow for calm, objective planning. Instead of reacting to every tick, you can set alerts at these monthly zones and wait for the market to come to you.
2 Downloads
Last Update:
May 04, 2026 10:00 AM
Published:
Jan 28, 2026 18:00 PM
Category: