The Natural Momentum Indicator for MT4 is a powerful tool designed to help traders identify shifts in market momentum and anticipate potential trend reversals. Unlike traditional momentum indicators that react to short-term price fluctuations, this version applies advanced smoothing techniques, including Triple EMA pre-smoothing, to filter market noise and provide a more accurate reflection of true momentum.
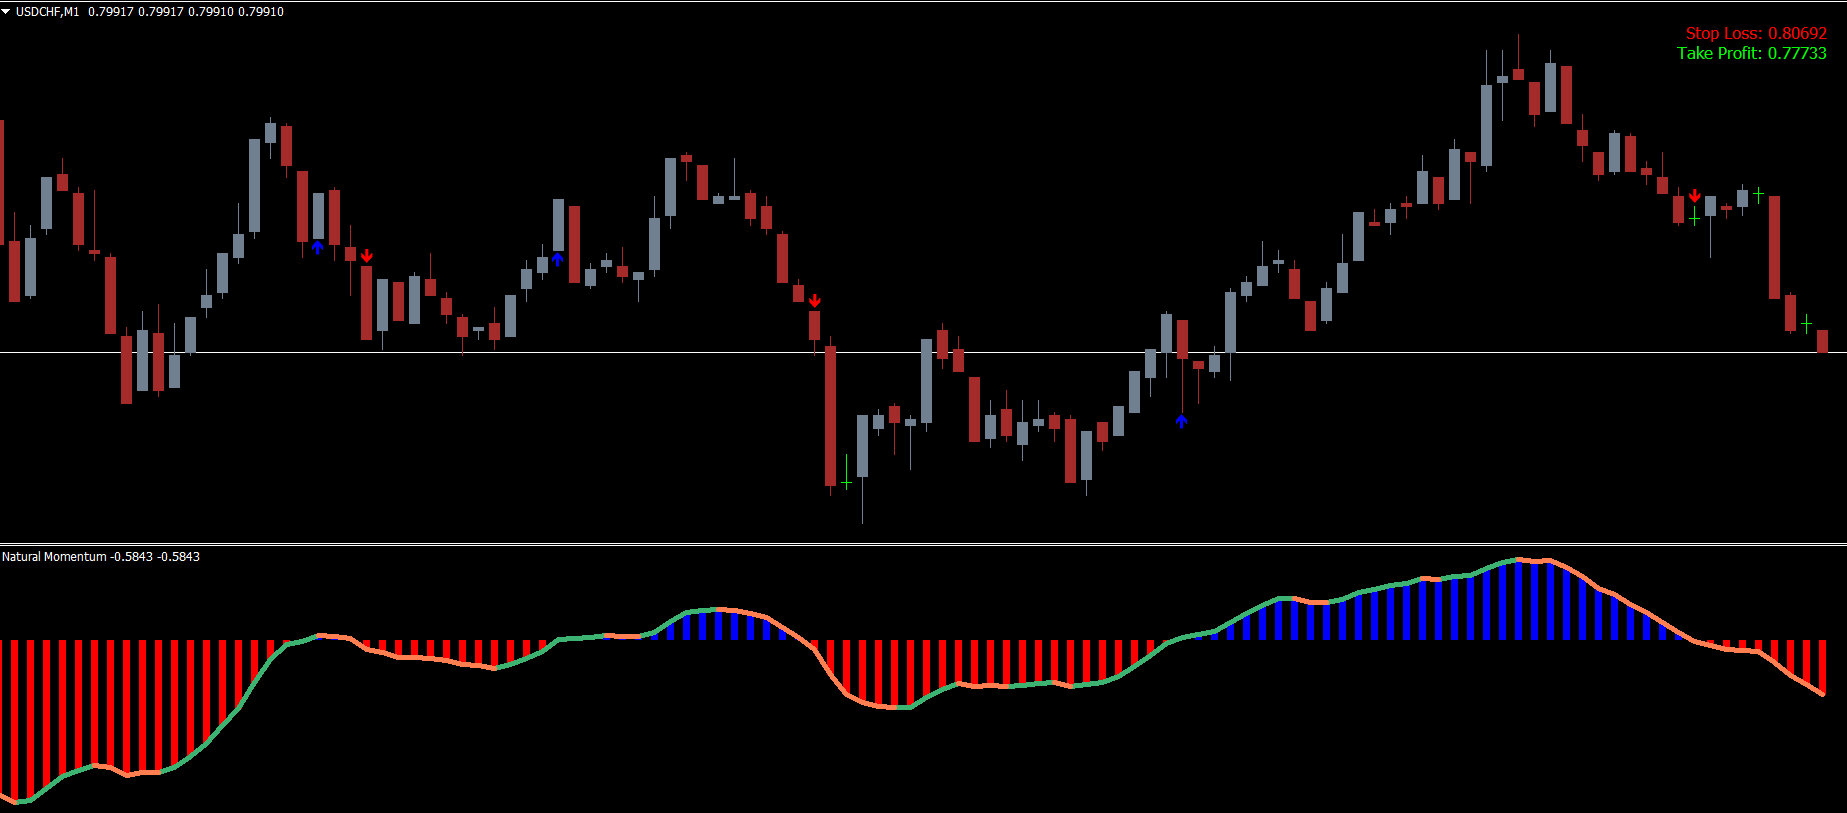
By displaying visual arrows and momentum bars, the indicator gives traders a clear understanding of bullish or bearish market phases. The blue arrow represents the beginning of bullish momentum, while the red arrow indicates the onset of bearish momentum. These arrows appear directly on your MT4 chart, offering instant and intuitive trading signals.
How the Natural Momentum Indicator Works
This indicator is designed around the principle that market momentum often changes before price direction. To capture these early movements, it analyzes the rate of change and direction of price over time. Then, through smoothing algorithms, it removes false signals caused by minor fluctuations.
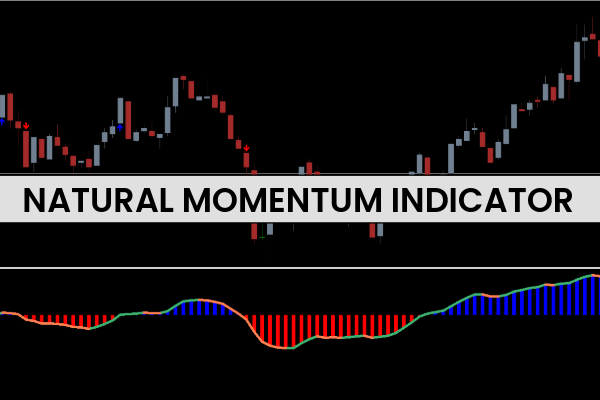
In the sub-window below the main chart, a histogram displays the strength and direction of momentum:
Blue bars signify bullish momentum, suggesting buying pressure.
Red bars indicate bearish momentum, signaling selling pressure.
These visual cues allow traders to make quick and confident trading decisions without extensive chart analysis.
Trading Signals with the Natural Momentum Indicator
The Natural Momentum Trading System is simple to apply across various instruments — including forex, commodities, indices, and cryptocurrencies.
Buy Signal (Long Trade):
A blue arrow appears on the chart.
The histogram bars turn blue, confirming bullish momentum.
Traders may enter a long position and use the pre-set stop loss and take profit levels that appear automatically.
Sell Signal (Short Trade):
A red arrow is displayed on the chart.
The histogram bars switch to red, confirming bearish momentum.
Enter a short position, managing risk using the suggested stop loss and profit targets.
Because the indicator calculates both entry and exit levels automatically, trade management becomes simpler and more efficient, even for beginners.
Advantages of Using the Natural Momentum Indicator for MT4
Accurate Trend Detection: The smoothing technique minimizes false signals.
Visual Simplicity: Clear arrows and color-coded bars make it easy to interpret.
Automated Risk Management: Built-in stop loss and take profit levels help control risk.
Custom Alerts: Traders receive real-time notifications for momentum shifts.
Universal Application: Works well on all MT4 timeframes and asset classes.
Whether you’re a short-term scalper or a swing trader, this indicator provides reliable momentum insights for both fast-paced and trending markets.
How to Combine Natural Momentum with Other Indicators
While the Natural Momentum Indicator can perform well as a standalone tool, it becomes even more powerful when combined with other technical indicators. For example:
RSI or Stochastic Oscillator: Confirms overbought or oversold zones.
Moving Averages: Helps determine long-term trend direction.
Support And Resistance Levels: Enhances entry precision and target setting.
This combination ensures that your trades align with the broader market context, boosting win rates and risk-to-reward ratios.
Conclusion
The Natural Momentum Indicator for MT4 provides traders with a complete view of market momentum using intuitive visual signals, smoothed trend analysis, and automatic trade management tools. By identifying early signs of momentum shifts, it helps you make better trading decisions and stay ahead of market reversals.
Whether you’re new to forex trading or a seasoned professional, this indicator offers simplicity, reliability, and precision. Download the Natural Momentum Indicator today from IndicatorForest.com and enhance your trading performance with one of the most advanced momentum analysis tools available.
FAQ
9 Downloads
Published:
Nov 11, 2025 10:34 AM
Category: