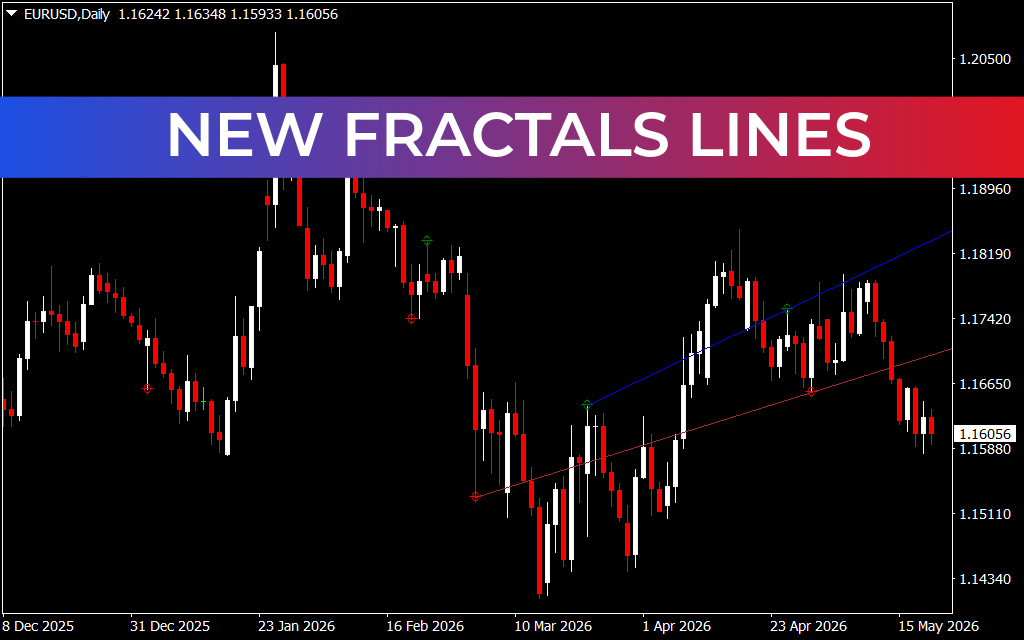
Simplify Structural Support and Resistance with the New Fractals Lines Indicator
Identifying true structural Support And Resistance lines is one of the most vital skills a technical trader can develop. However, manual charting leaves too much room for subjective bias. Retail traders often crowd their screens with arbitrary lines drawn from minor, insignificant price fluctuations. When the market approaches these weak areas, price frequently slices straight through them, causing unexpected losses and frustration.
The New Fractals Lines indicator solves this dilemma by introducing mathematical objectivity to your charting template. Built around enhanced geometric calculations, this premium charting tool scans the market on autopilot to map out true institutional turning points across any financial asset class.
What is the New Fractals Lines Indicator?
The New Fractals Lines indicator is an automated support and resistance engine built for modern MetaTrader platforms. It optimizes the core concept of Bill Williams' classic fractal theory—which isolates local high and low turning points based on specific candlestick sequences—and extends those points into continuous horizontal or sloped trend channels.
Instead of displaying messy, standalone geometric arrows that disappear behind historical data, this indicator connects significant swing highs and swing lows using real-time structural vectors. The resulting channel baselines represent major historical zones where aggressive institutional buying or selling has previously occurred. Because the software filters out minor price noise, the lines left on your screen serve as highly accurate structural thresholds.
Key Features and Strategic Advantages
- Automated Structural Mapping: Instantly eliminates the manual labor of plotting key levels, allowing you to focus purely on strategic execution.
- Dynamic Trendline Channels: Automatically links key structural peaks and troughs to form reliable support and resistance boundaries.
- Reduced Multi-Timeframe Confusion: Delivers a clear, uncluttered look at major price milestones, making it highly effective for multi-timeframe analysis.
- Universal Usability: Operates flawlessly across diverse asset classes, whether you are Scalping intra-hour structures on the M15 or swing trading macro trends on daily charts.
How to Trade with New Fractals Lines
Integrating these mathematical structural channels into your mechanical ruleset helps filter out low-probability setups:
1. Trendline Bounce Strategies
In a structured trending market, the upper and lower bands generated by the indicator act as dynamic walls. When price corrective pullbacks hit a rising fractal support line, look for bullish candlestick validation to catch the next impulsive trend expansion wave early.
2. Institutional Breakouts
When a highly compressed market builds enough volume to close a candle completely outside the indicator’s horizontal or sloped channels, a true structural breakout is under way. Traders can safely trade in the direction of the breach, targeting the next historical fractal level.
3. Trailing Risk Parameters
The lines plotted by this indicator provide objective zones for structural risk management. When going long after a bounce, position your defensive stop-loss directly below the nearest lower fractal baseline to ensure your position is protected by actual Market Structure.
Conclusion
Relying on guesswork to find key chart levels is a fast track to underperformance. The New Fractals Lines indicator transforms raw price data into an objective, math-backed map of institutional support and resistance. Upgrade your charting layout today to start targeting your entries and exits with absolute structural clarity.
2 Downloads
Last Update:
May 21, 2026 16:48 PM
Published:
Jan 17, 2026 19:55 PM
Category: