Multi-Timeframe Mastery: The Power of Nine TF Movement for MT4/MT5
In the fast-moving world of financial markets, the biggest mistake a trader can make is looking at the market through a single lens. A bullish setup on a 5-minute chart can quickly turn into a trap if the hourly or daily trends are overwhelmingly bearish. To solve this problem, professional traders use multi-timeframe (MTF) analysis. The Nine TF Movement Indicator is a sophisticated dashboard designed to provide this institutional-grade perspective at a single glance.
What is the Nine TF Movement Indicator?
The Nine TF Movement Indicator is a comprehensive market sentiment dashboard that aggregates Price Action data across nine distinct timeframes: from the ultra-fast 1-minute (M1) chart to the long-term Monthly (MN1) perspective. Instead of manually flipping through tabs, this indicator presents a clean, color-coded interface at the bottom of your chart.
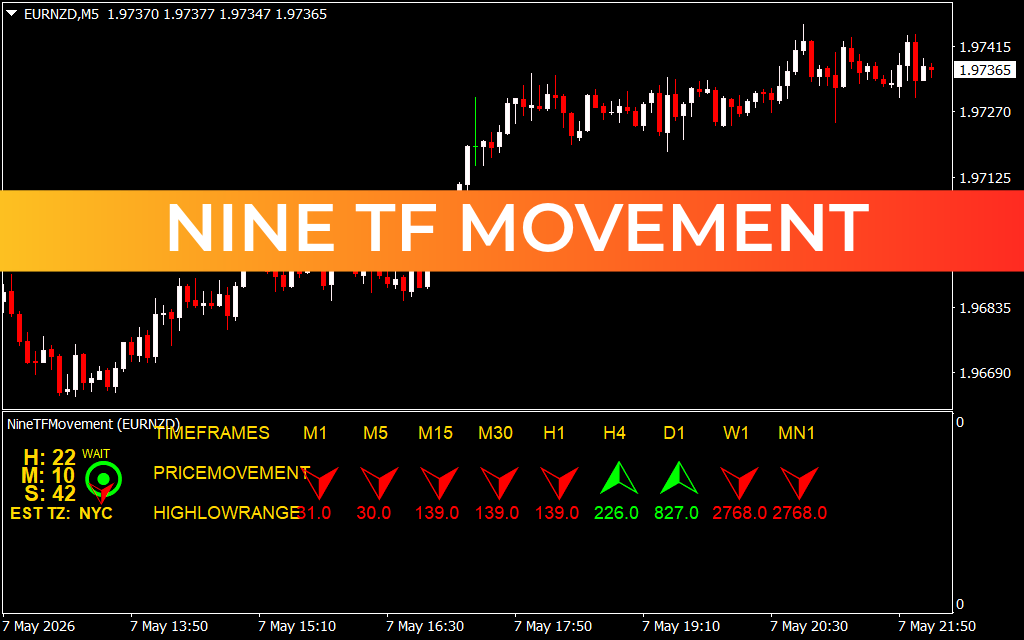
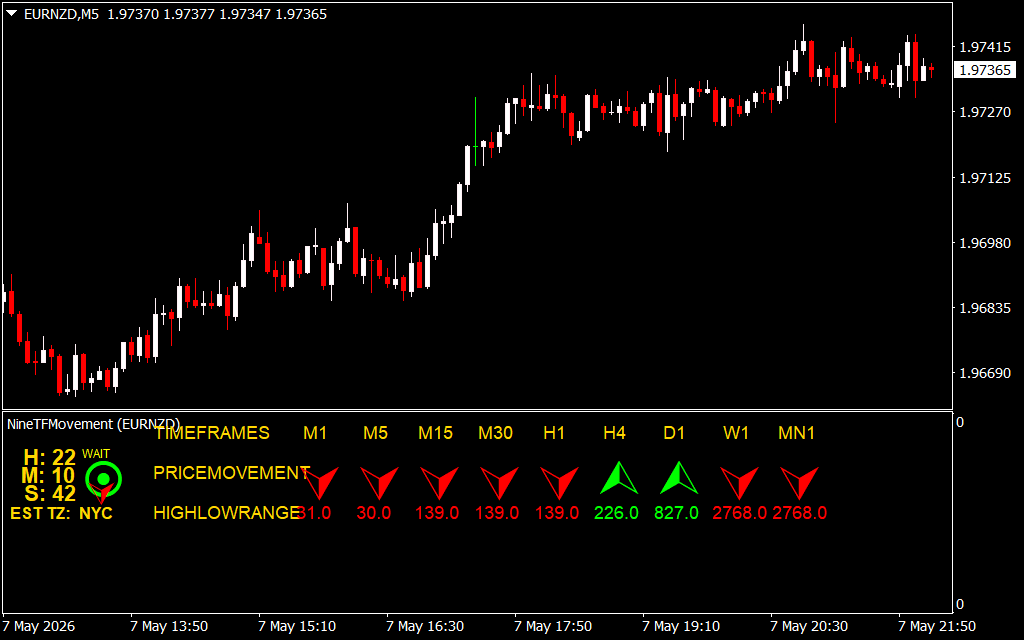
As seen in the EURNZD M5 example, the indicator displays:
- Price Movement Direction: Red downward arrows and green upward arrows instantly reveal which way the market is leaning across every relevant period.
- High/Low Range Data: Numerical values quantify the current range or volatility for each timeframe, helping you understand if a move has room to run or is overextended.
- Real-Time Clock & Session Info: Includes an integrated countdown timer (H:M:S) and timezone tracking (e.g., EST TZ: NYC) to ensure you are always aware of session opens and candle closes.
The Strategic Advantage of MTF Dashboards
Trading with the Nine TF Movement Indicator offers several key benefits that single-chart setups simply cannot match:
- Trend Confluence: The highest-probability trades occur when multiple timeframes align. If the dashboard shows green arrows across M30, H1, and H4, a "Buy" signal on your M5 chart is backed by significant market weight.
- Early Warning System: Often, a Trend Reversal begins on the M1 or M5 timeframe before it is visible on higher charts. By watching the dashboard, you can see the "shift" in sentiment before it hits the main price action.
- Reduced Analysis Paralysis: Instead of cluttering your screen with dozens of windows, the Nine TF Movement condenses all essential data into one organized panel, allowing for faster and more confident execution.
- Volatility Tracking: The High/Low range data is vital for setting realistic take-profit and stop-loss levels based on the actual average movement of the day.
Conclusion
The Nine TF Movement Indicator is more than just a signal tool; it is a situational awareness engine. By providing a panoramic view of the market, it empowers you to trade with the "big picture" in mind. Whether you are a scalper seeking quick momentum alignment or a swing trader looking for institutional entry points, this dashboard is an essential addition to any MetaTrader setup.
8 Downloads
Last Update:
May 08, 2026 01:12 AM
Published:
Jan 26, 2026 14:57 PM
Category: