Decoding Market Intent: The Normalized Volume V1 Indicator for MT4
In the high-velocity world of technical analysis, Price Action often gets all the glory. However, seasoned traders know that price is merely the effect; volume is the cause. Standard volume indicators can be difficult to interpret because they present raw data that varies wildly between different sessions and timeframes. The Normalized Volume V1 indicator for MetaTrader 4 (MT4) is a sophisticated analytical tool designed to bring mathematical clarity to market activity by smoothing and scaling volume data into a readable, actionable format.
Why Normalization Matters
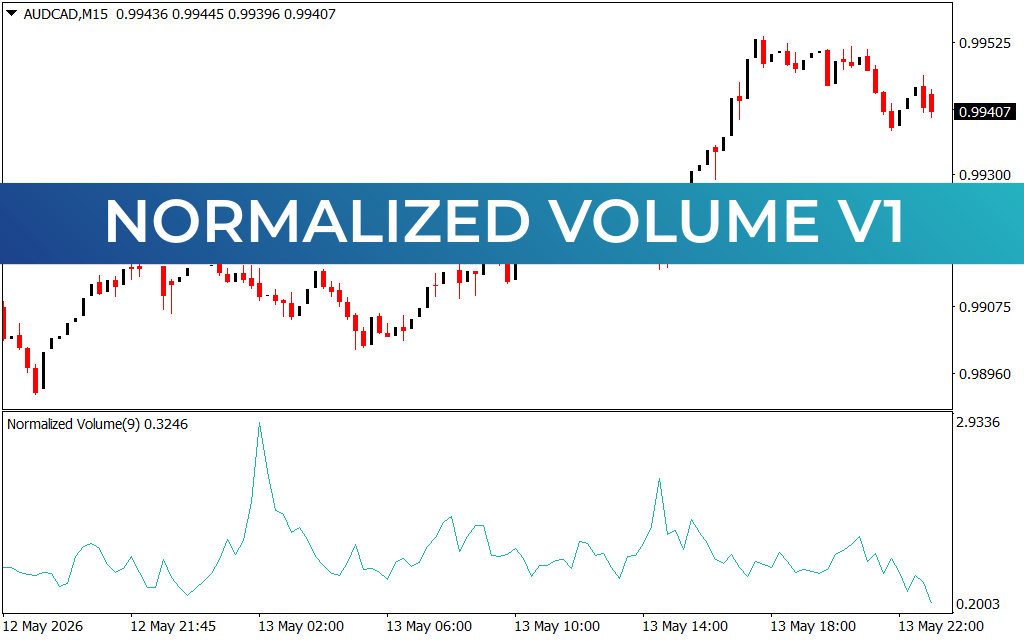
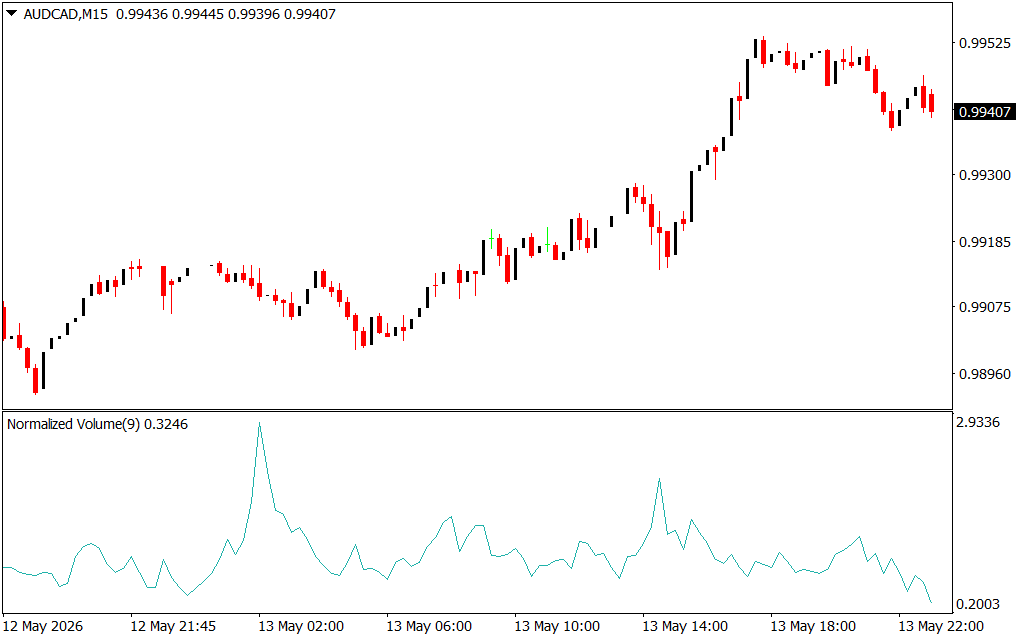
The primary challenge with raw volume is its inconsistency. A volume spike during the London-New York overlap looks vastly different from a spike during the Asian session. The Normalized Volume V1 solves this by applying a normalization algorithm—typically using a mathematical lookback period (as seen in the "Normalized Volume(9)" setting in the provided chart)—to compare current activity against recent historical averages.
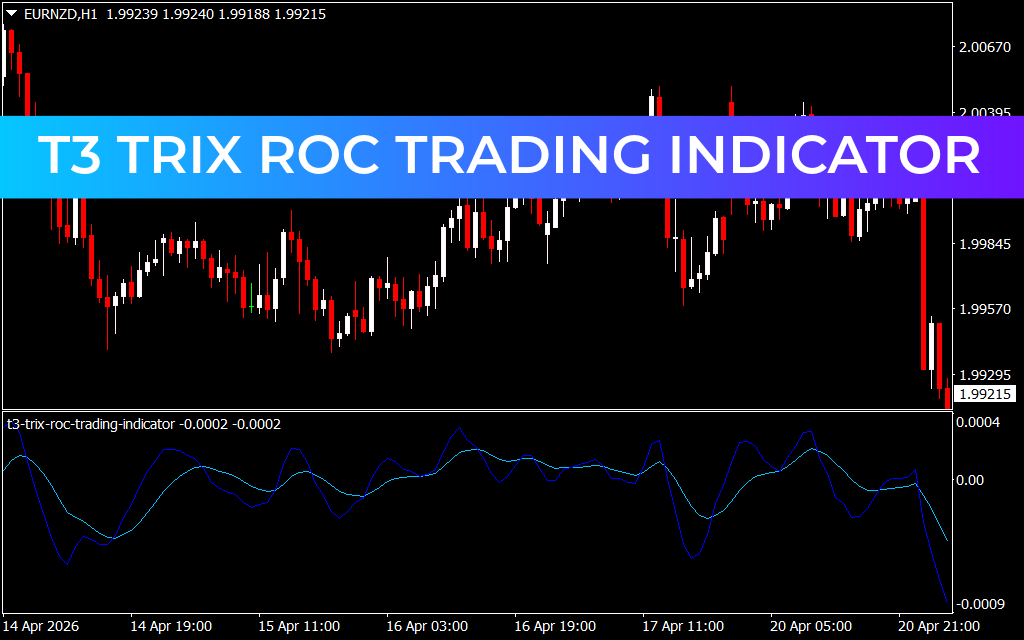
As illustrated in the AUD/CAD M15 chart, the indicator appears as a clean, continuous line in a dedicated sub-window. Instead of jagged bars, you see a fluid representation of market participation. This allows traders to identify "Relative Volume"—the true intensity of a move compared to what is normal for that specific time of day.
Key Features of Normalized Volume V1
Traders looking for an edge in momentum and breakout strategies rely on this tool for several critical reasons:
- Spotting Smart Money Exhaustion: High normalized volume at the end of a long trend often signals a "climax" or exhaustion point, warning traders to tighten stops or exit positions before a reversal occurs.
- Confirming Breakouts: A price breakout from a consolidation zone is only valid if it is accompanied by a surge in normalized volume. In the provided example, notice how the bullish run toward the 09:44.45 peak is supported by sustained peaks in the volume line.
- Filtering Market Noise: By smoothing the volume data, the V1 version helps you ignore the minor "ticks" that can clutter your analysis during low-liquidity periods.
- Objective Momentum Barometer: The vertical scale (ranging from 0.2003 to 2.9336 in the example) provides an objective way to measure market heat. A reading above 2.0 indicates extreme participation, whereas a sub-0.5 reading suggests the market is "sleeping."
Strategic Application: The Volume-Price Synergy
To get the most out of the Normalized Volume V1, use it as a "conviction filter." If the price is rallying but the normalized volume is trending downward, the move is likely a "bull trap" driven by low liquidity. Conversely, when you see price making higher highs and the normalized volume line is also making higher peaks, you have confirmation of a healthy, institutional-led trend.
For day traders on the M15 timeframe, these volume peaks act as early warning systems. The massive volume spike seen around the 02:00 mark in the AUD/CAD chart highlighted a surge of interest that set the stage for the structural support levels that held throughout the day. By understanding the "why" behind the move through volume normalization, you can trade with significantly higher confidence.
2 Downloads
Last Update:
May 14, 2026 02:28 AM
Published:
Jan 22, 2026 14:48 PM
Category: