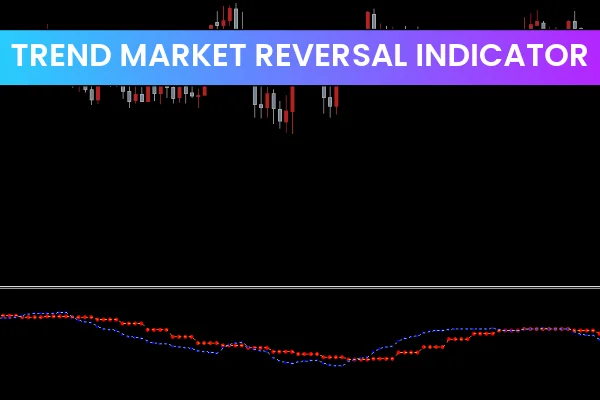
The Trend Market Reversal Indicator for MT4 helps traders identify potential changes in market direction using a simple yet effective approach: two Exponential Moving Averages (EMAs). These EMAs help traders understand Trend Strength, potential reversals, and precise entry/exit points.
The indicator plots a faster EMA and a slower EMA. When these two lines cross, a possible change in trend direction is signaled.
How the Trend Market Reversal Indicator Works
The indicator uses two EMA lines known as:
Signal-Up EMA
Signal-Down EMA
As their names suggest, one EMA highlights upward momentum, while the other highlights downward pressure. The relationship between these two lines helps traders anticipate where the market might move next.
EMA Crossovers Explained
Bullish Reversal:
When the faster EMA (signal-up) crosses above the slower EMA, an upward trend reversal is likely forming.
Bearish Reversal:
When the slower EMA (signal-down) crosses above the faster EMA, a downward Trend Reversal is likely forming.
Because the indicator magnifies these signals, traders can easily spot both early reversals and strong continuation signals.
The indicator also provides multiple trading opportunities, offering several potential entry and exit points within a single trend.
How to Trade Using the Trend Market Reversal Indicator
The trend reversal indicator behaves similarly to most EMA-based reversal systems, but with clearer separation between bullish and bearish momentum through the signal-up and signal-down lines.
Below are the trading strategies for both buying and selling setups.
Buy Strategy (Bullish Setup)
Signal-up EMA must cross above the signal-down EMA.
Wait for the crossover to complete and the signal-up line to clearly move above.
Enter the buy trade when the two lines confirm direction.
Place your stop-loss below the recent swing low.
Exit the trade when the trend shifts and the lines cross in the opposite direction.
Sell Strategy (Bearish Setup)
Signal-down EMA must cross above the signal-up EMA.
Wait for the crossover to fully confirm.
Enter the sell trade when both lines show clear downward direction.
Place your stop-loss above the recent swing high.
Exit the trade when a bullish reversal signal appears.
Conclusion
The Trend Market Reversal Indicator for MT4 is an excellent tool for identifying potential market turning points. It helps traders pinpoint exact entries and exits with ease by analyzing EMA crossovers.
You can use this indicator on any timeframe and apply it to any currency pair. For even better performance, combine it with additional technical analysis tools such as:
FAQ
Published:
Nov 25, 2025 00:04 AM
Category: