Unlocking Reversal Signals: The RSI Divergence Indicators Explained
The Relative Strength Index ($RSI$) is one of the most widely implemented momentum oscillators in technical analysis, engineered to evaluate overbought or oversold conditions in financial assets. Yet, simply trading raw $RSI$ boundary extensions—such as buying blindly when the value dips below 30—often exposes retail traders to severe losses when an asset gets caught in a prolonged institutional markdown phase. To capture genuine turning points with precision, professional chartists study the structural discrepancies between Price Action and momentum. RSI Divergence Indicators automate this complex matching process, mapping institutional exhaustion directly onto your trading workspace.
Here is an analysis of how these automated divergence engines function and how to use them to time your market entries.
The Structural Science of Momentum Divergence
A divergence occurs when the structural trajectory of price action falls out of sync with the mathematical velocity of an oscillator. Under standard market conditions, price waves and momentum move in parallel corridors; when price prints a lower swing low, the oscillator should mirror that decline by making a lower trough.
When this relationship breaks down, it exposes a shift in Market Structure:
- Bullish Divergence: Price action achieves a lower structural low, signaling a continuation of the bearish trend to retail observers. Simultaneously, the $RSI$ prints a distinct higher low, revealing that the internal selling velocity is drying up despite the lower print.
- Bearish Divergence: Price action climbs to a fresh higher high, but the oscillator tops out at a lower peak. This mismatch alerts traders that the buying rally lacks true institutional capital expansion and is highly vulnerable to a sudden liquidation.
By tracking these momentum shifts, traders can spot structural turning points before they manifest on the main candlestick layout.
Analyzing Automated Cues on Intraday Charts
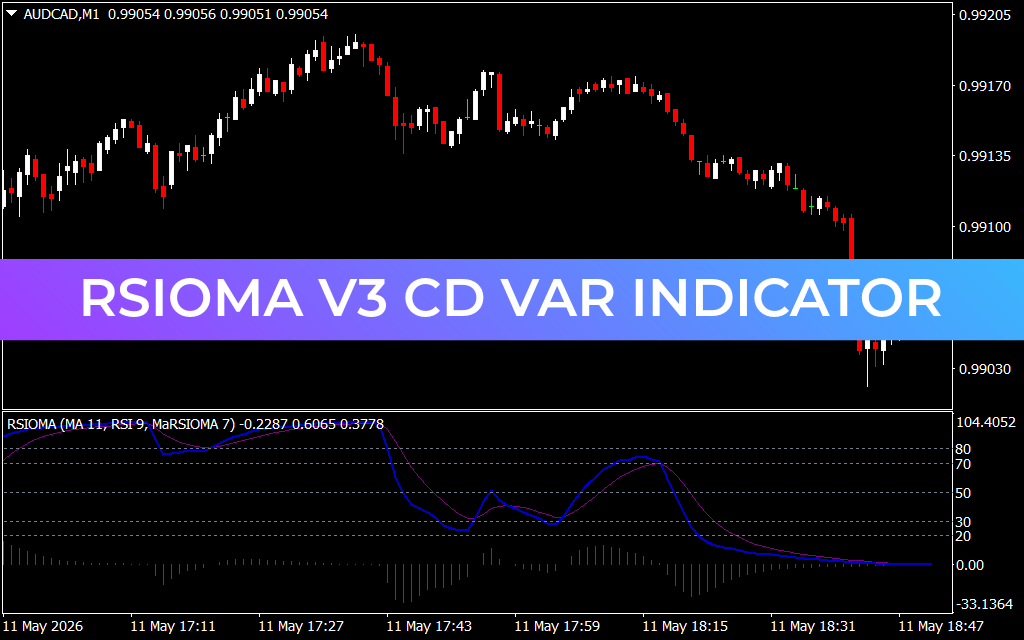
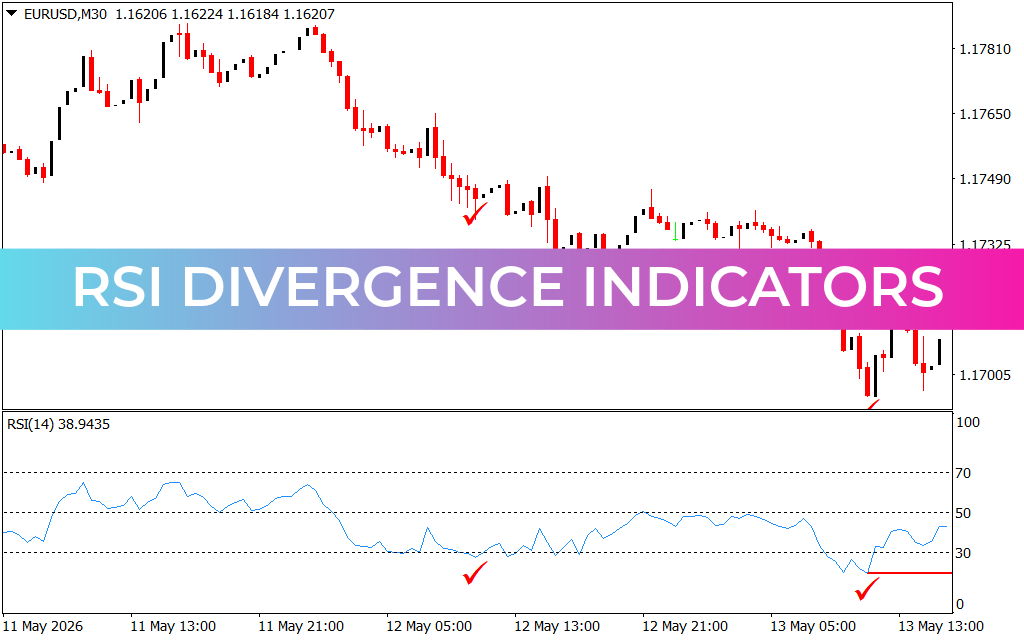
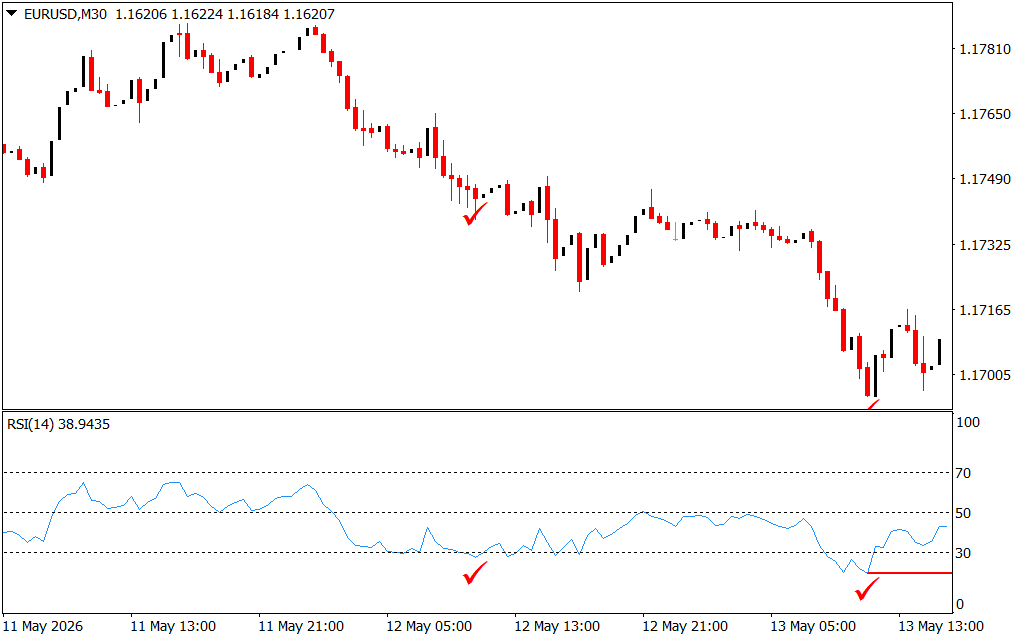
As demonstrated on the EUR/USD M30 chart, an automated divergence indicator simplifies the identification process by highlighting real-time discrepancies:
- The Sub-Window Tracking (RSI Window): The indicator plots the standard 14-period boundary lines at the $30.00$, $50.00$, and $70.00$ axes. As the currency pair liquidates toward May 13, the momentum line enters the oversold territory below 30.
- The Divergence Match: While the price chart drops to a lower low, the indicator detects an ascending slope in the $RSI$ troughs, marking the inflection point with a solid red validation bar.
- The Confirmation Markers: To assist execution timing, the engine stamps clear red checkmarks ($\checkmark$) directly beneath the corresponding price candles and $RSI$ troughs. This visual cue alerts the trader that a structural divergence has officially locked into the terminal history.
Professional Guidelines for Execution Terminals
To maximize the performance of RSI Divergence Indicators within your active trading system, implement these core rules:
- Avoid Catching Falling Knives: Do not execute a position the exact moment a divergence begins to form. Wait for the indicator to print its final validation mark and ensure the $RSI$ line hooks back above the 30 axis to confirm that buying pressure has entered the market.
- Contextual Market Structure: Always prioritize divergence signals that develop at major historical support zones or daily demand blocks. A bullish divergence matching a major daily level carries a significantly higher win rate than a standalone signal in mid-range noise.
- Systematic Stop Placement: When entering a long position based on an verified checkmark signal, place your defensive stop-loss order a few pips beneath the physical swing low of the triggering candlestick structure.
1 Download
Last Update:
May 17, 2026 02:07 AM
Published:
Jan 20, 2026 22:45 PM
Category: