OBV (On-Balance Volume) is a volume-based indicator that measures buying and selling pressure. It adds volume on up days and subtracts it on down days, creating a cumulative line that reflects market strength or weakness behind price movements.
Divergence occurs when the OBV line and Price Action move in opposite directions. This mismatch often signals an upcoming change in market direction:
Bullish Divergence: Price forms a lower low, but OBV makes a higher low — indicating potential upward movement.
Bearish Divergence: Price makes a higher high, but OBV forms a lower high — suggesting a possible bearish reversal.
How the OBV Divergence Indicator Works
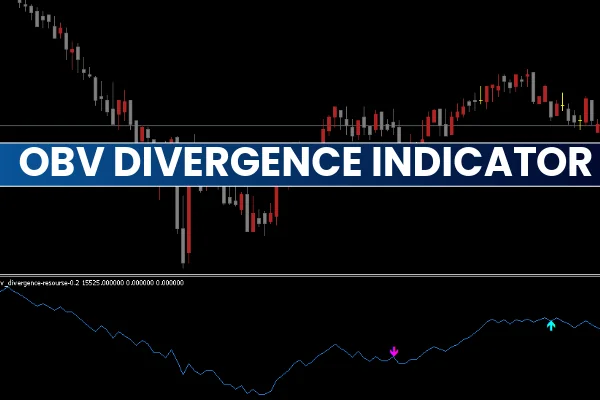
The OBV Divergence Indicator for MT5 automatically scans the chart for both normal (classic) and hidden divergences. It then displays colored arrow signals on the chart:
Blue Up Arrow: Bullish divergence – a possible buy signal.
Red Down Arrow: Bearish divergence – a possible sell signal.
This automated detection saves traders the time and effort of manually comparing OBV and price highs/lows.
How to Trade Using the OBV Divergence Indicator in MT5
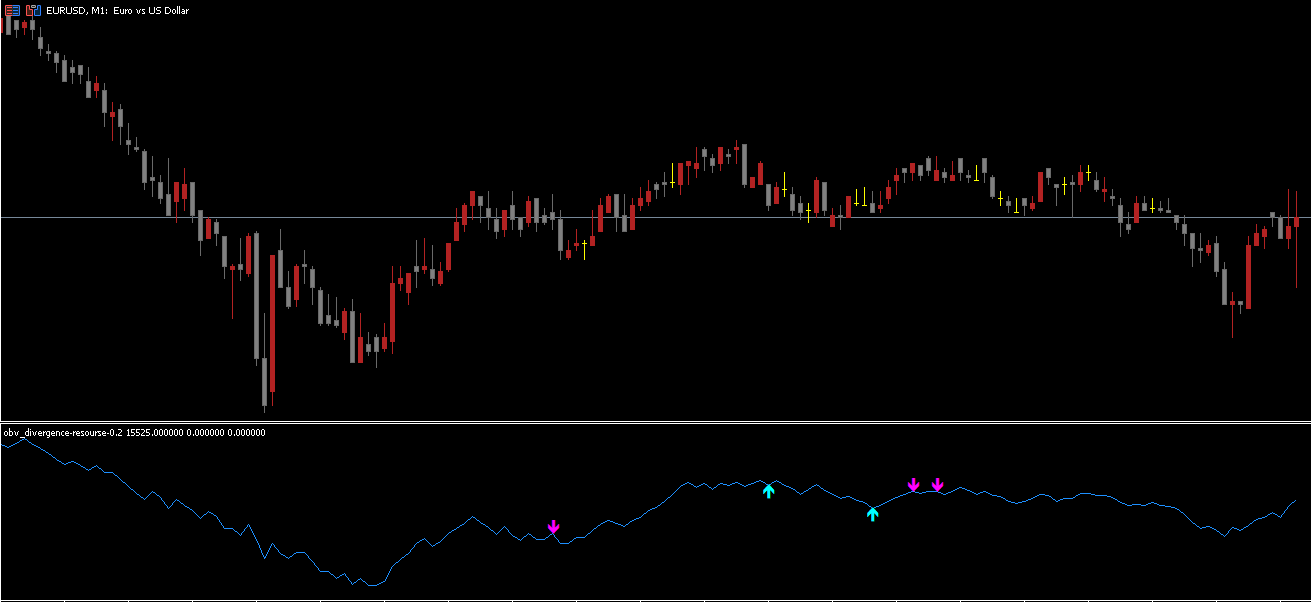
In the chart example above, the OBV Divergence Indicator identifies three major setups:
Hidden Bearish Divergence:
Price forms a lower high while OBV makes a new high.
This signals that selling pressure is increasing.
The indicator plots a red arrow, suggesting a sell trade.
Classic Bearish Divergence:
Price makes a higher high, but OBV makes a lower high.
This indicates weakening buying pressure and a potential downward reversal.
Traders can enter short positions after confirmation.
Hidden Bullish Divergence:
Price makes a higher low while OBV forms a lower low.
This signals that buyers are returning, possibly starting a bullish trend.
A blue arrow appears, marking a buy opportunity.
Trading Tips
Combine OBV Divergence with support/resistance levels, trendlines, or moving averages to improve accuracy.
Avoid trading divergence signals during low volume or sideways markets.
Confirm signals on higher timeframes for stronger reliability.
The indicator works best when used as part of a multi-indicator strategy that includes volume and momentum confirmation tools.
Why Use the OBV Divergence Indicator for MT5
Automatically detects bullish and bearish divergences.
Works with all timeframes and currency pairs.
Ideal for manual and automated divergence traders.
Simplifies complex divergence analysis for beginners.
Enhances the accuracy of trade entries and exits.
Conclusion
The OBV Divergence Indicator for MT5 simplifies divergence trading by automatically identifying hidden and classic divergence setups between price and volume. By clearly marking bullish and bearish signals with arrows, it allows traders to take timely buy and sell decisions without manual analysis.
While OBV is one of the most powerful tools for detecting volume-based divergences, traders can further improve results by combining it with indicators like RSI, MACD, or Stochastic Oscillator. This makes the OBV Divergence Indicator a valuable addition to any MT5 trading strategy.
FAQ
4 Downloads
Published:
Nov 09, 2025 02:32 AM
Category: