Mastering Volume Confluence: The OBV MTF Indicator for MT4
In technical analysis, price data only tells part of the story. A sharp upward breakout or a sudden liquidation leg can easily trap retail traders if the movement lacks real institutional volume backing it up. To prevent getting caught on the wrong side of false breakouts, professional market technicians look for volume accumulation. The OBV MTF (On-Balance Volume Multi-Timeframe) Indicator provides a powerful solution by tracking institutional order flow across multiple timeframes simultaneously and displaying it cleanly on a single chart.
Here is an analytical breakdown of how this volume-tracking indicator functions and how to use its multi-timeframe dashboard to improve your execution precision.
The Mathematical Logic of On-Balance Volume
Originally created by Joseph Granville in the 1960s, On-Balance Volume ($OBV$) is a fundamental Momentum Indicator that uses volume flow to predict major price changes. The mathematical formula updates based on the asset's closing price:
- Bullish Close: If the current candlestick closes higher than the previous close, the period's volume is assigned a positive value and added to a running $OBV$ total.
- Bearish Close: If the current candlestick closes lower than the previous close, the volume is assigned a negative value and subtracted from the total.
The OBV MTF indicator upgrades this classic calculation by transforming it into a multi-timeframe dashboard. Instead of forcing you to flip through different chart tabs to check volume conditions, the indicator gathers lookback data from various intervals and displays it right on your main screen. This gives you a clear view of whether large institutional buyers are genuinely accumulating or distributing an asset.
Reading the Multi-Timeframe Status Panel
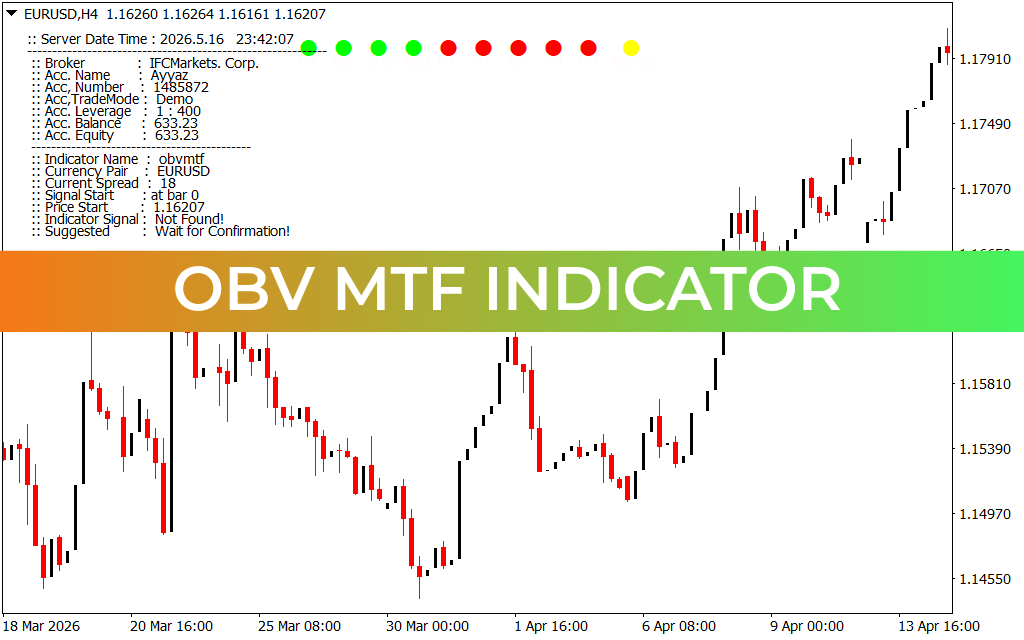
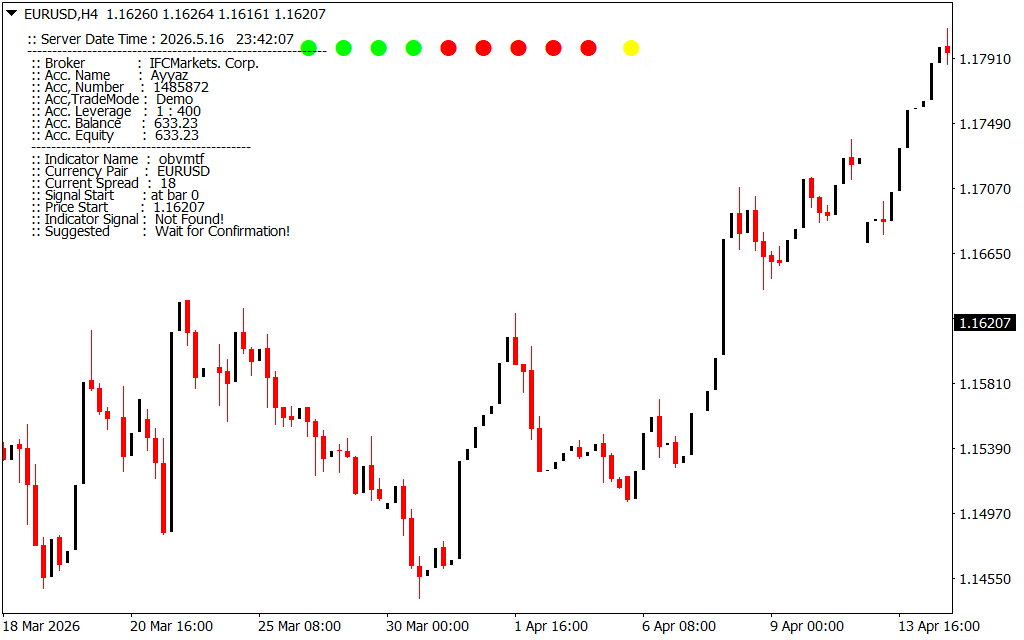
As shown on the EUR/USD 1-minute and 4-hour workspaces, the indicator functions as an elegant information dashboard, displaying essential broker details along with a streamlined matrix of trend dots:
- The Account and Market Terminal Panel: The indicator prints a clean text menu in the upper-left corner of your workspace. This data panel keeps you updated on your active broker name, account leverage settings, real-time spread margins, and equity levels, ensuring you have a clear overview of your terminal's operating conditions.
- The Multi-Timeframe Volume Row (M1 to MN1 Dots): Located at the top center of your chart, a horizontal row of colored nodes maps out volume conditions from the 1-minute ($M1$) chart all the way up to the Monthly ($MN$) view.
- Decoding the Color-Coded Matrix: The dashboard uses an intuitive color system to represent volume trends:
- Bright Green Nodes: Signal that $OBV$ is expanding aggressively on that timeframe, confirming healthy institutional accumulation.
- Bright Red Nodes: Warn traders that volume distribution is dominating the interval, pointing to systemic selling pressure.
- Yellow Status Node: Acts as a specialized velocity marker, alerting you to sudden momentum shifts or structural turning points.
Strategic Execution Rules for Active Day Traders
To maximize the mathematical edge provided by the OBV MTF dashboard on your MetaTrader terminal, implement these active management rules:
- Trade Pure Volume Synchronicity: Use the dashboard as a strict structural filter. For high-probability long entries, wait until the intraday dots ($M1$, $M5$, $M15$) and the macro dots ($H1$, $H4$, $D1$) all light up bright green. Trading with complete volume confluence ensures you line up your execution with institutional order flow.
- Identifying Divergence Reversals: If Price Action prints a fresh high on your intraday chart but the higher-timeframe dashboard nodes ($H4$ or $D1$) remain red, it reveals a bearish divergence. This warning sign suggests that the upward move is a low-volume retail trap, advising you to look for short setups instead.
- Capital Protection in Low-Volume Markets: When the multi-timeframe dots show a mixed combination of green and red colors across consecutive intervals, the market is trapped in a non-trending range. Stand aside and wait for a clear row of matching colors before risking capital.
1 Download
Last Update:
May 17, 2026 02:43 AM
Published:
Jan 20, 2026 22:17 PM
Category: