Mastering Multi-Timeframe Forex Trading with the OGT Trend Dashboard
In the fast-paced world of Forex trading, aligning with the market trend is one of the most reliable ways to secure consistent profits. However, analyzing multiple timeframes to find a confluence of trends can be an exhausting task. Traders often find themselves flipping back and forth between 1-minute and monthly charts, missing crucial entry points in the process.
The OGT Trend Dashboard solves this problem by consolidating multi-timeframe trend analysis into a single, intuitive visual interface directly on your MetaTrader platform.
What is the OGT Trend Dashboard?
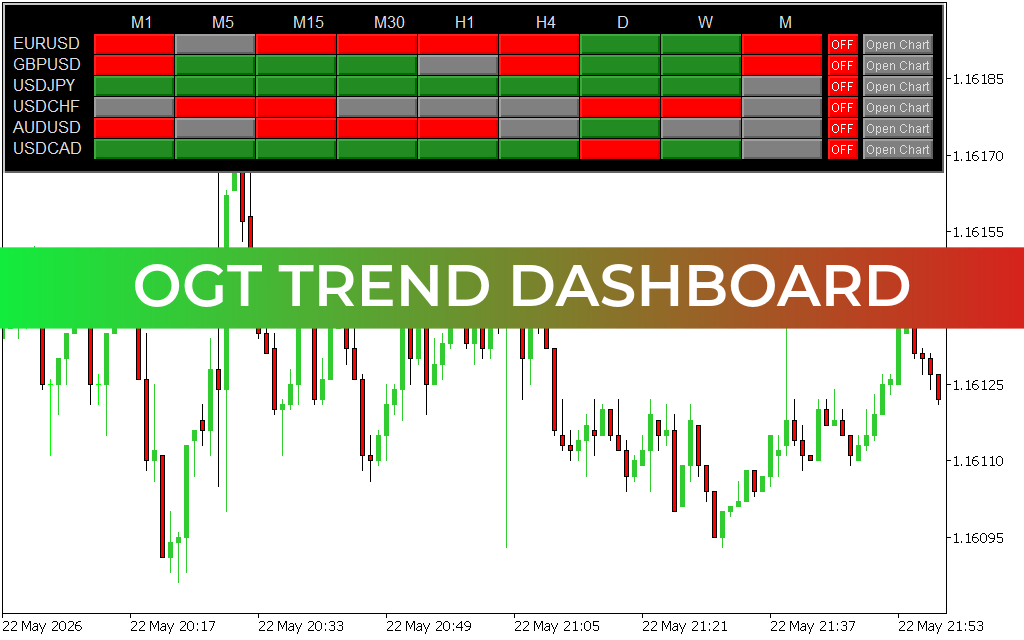
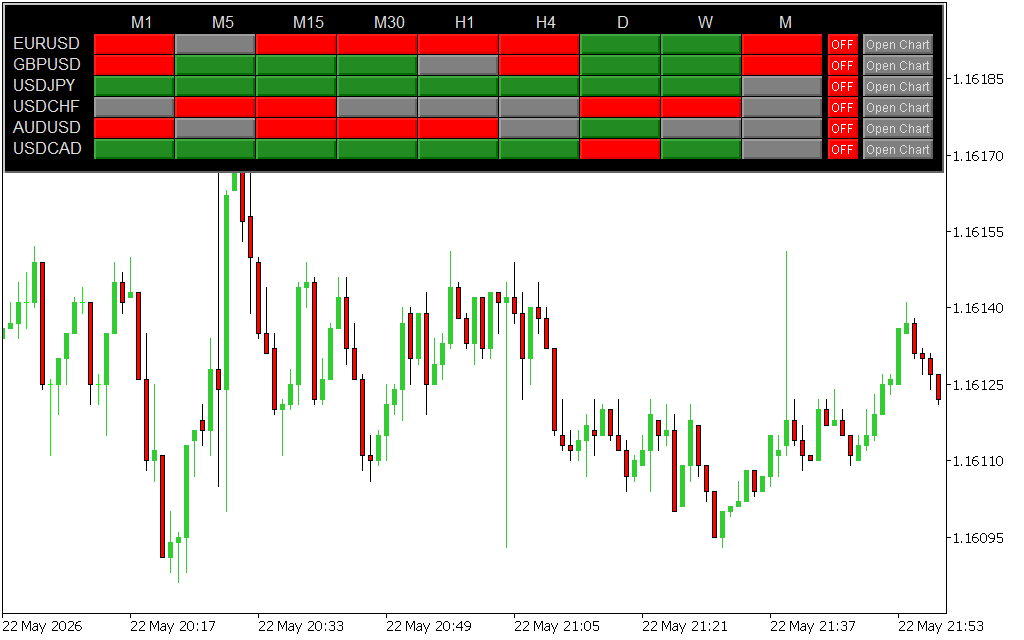
The OGT Trend Dashboard is a powerful technical indicator designed to give traders an instant snapshot of market directions across multiple currency pairs and timeframes. As seen in the EURUSD M1 chart, the dashboard sits cleanly at the top of your workspace, providing real-time data from the 1-minute (M1) up to the Monthly (M) intervals.
By tracking majors like EURUSD, GBPUSD, and USDJPY simultaneously, it removes the guesswork from trend trading and allows you to spot high-probability setups at a glance.
Key Features and Functionality
- Color-Coded Trend Overview: The dashboard utilizes a simple, highly effective color system. Green indicates a bullish (upward) trend, Red signifies a bearish (downward) trend, and Grey represents a neutral or ranging market.
- Multi-Timeframe Confluence: High-probability trades occur when lower timeframes align with higher timeframes. The OGT Trend Dashboard allows you to easily identify when short-term momentum (e.g., M1 or M5) matches the macro direction (e.g., H4 or Daily).
- One-Click Chart Navigation: With integrated "Open Chart" buttons next to each asset row, you can instantly dive into a specific currency pair when a trading signal aligns.
- Clean Chart Workspace: By housing all your multi-timeframe data inside one compact window, it keeps your main candlestick charts clean and free of cluttered moving averages or oscillators.
How to Trade Using the OGT Trend Dashboard
To maximize the effectiveness of this tool, traders typically look for trend alignment. For instance, if you are a day trader looking to buy EURUSD, you would ideally wait for the M15, H1, and H4 blocks to turn green. When the lower M1 or M5 timeframes also turn green, it signals an optimal, low-risk entry point in the direction of the broader market momentum.
Conversely, if the dashboard shows a chaotic mix of red and green blocks across timeframes, it warns you that the market is currently ranging—advising you to sit on your hands and protect your capital. Whether you are a scalper, swing trader, or position trader, this dashboard adapts to your specific time horizon to streamline your daily market analysis.
4 Downloads
Last Update:
May 23, 2026 01:18 AM
Published:
Jan 17, 2026 14:08 PM
Category: